DFI Retail Group Holdings (SGX:D01) shareholders have endured a 67% loss from investing in the stock five years ago
We think intelligent long term investing is the way to go. But along the way some stocks are going to perform badly. For example, after five long years the DFI Retail Group Holdings Limited (SGX:D01) share price is a whole 72% lower. We certainly feel for shareholders who bought near the top. And some of the more recent buyers are probably worried, too, with the stock falling 31% in the last year. Furthermore, it's down 14% in about a quarter. That's not much fun for holders. But this could be related to the weak market, which is down 6.0% in the same period.
So let's have a look and see if the longer term performance of the company has been in line with the underlying business' progress.
See our latest analysis for DFI Retail Group Holdings
While the efficient markets hypothesis continues to be taught by some, it has been proven that markets are over-reactive dynamic systems, and investors are not always rational. One way to examine how market sentiment has changed over time is to look at the interaction between a company's share price and its earnings per share (EPS).
During the five years over which the share price declined, DFI Retail Group Holdings' earnings per share (EPS) dropped by 43% each year. This fall in the EPS is worse than the 22% compound annual share price fall. The relatively muted share price reaction might be because the market expects the business to turn around. The high P/E ratio of 112.64 suggests that shareholders believe earnings will grow in the years ahead.
The company's earnings per share (over time) is depicted in the image below (click to see the exact numbers).
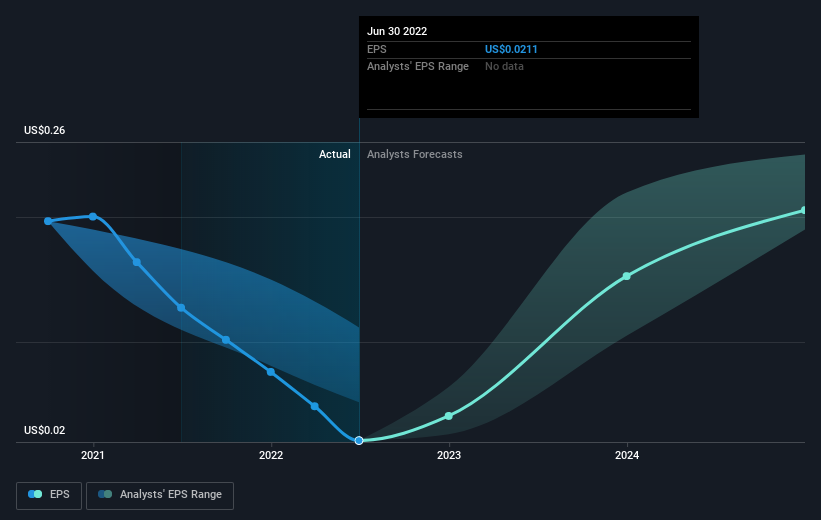
This free interactive report on DFI Retail Group Holdings' earnings, revenue and cash flow is a great place to start, if you want to investigate the stock further.
What About Dividends?
When looking at investment returns, it is important to consider the difference between total shareholder return (TSR) and share price return. The TSR is a return calculation that accounts for the value of cash dividends (assuming that any dividend received was reinvested) and the calculated value of any discounted capital raisings and spin-offs. So for companies that pay a generous dividend, the TSR is often a lot higher than the share price return. We note that for DFI Retail Group Holdings the TSR over the last 5 years was -67%, which is better than the share price return mentioned above. And there's no prize for guessing that the dividend payments largely explain the divergence!
A Different Perspective
While the broader market lost about 3.8% in the twelve months, DFI Retail Group Holdings shareholders did even worse, losing 28% (even including dividends). Having said that, it's inevitable that some stocks will be oversold in a falling market. The key is to keep your eyes on the fundamental developments. Regrettably, last year's performance caps off a bad run, with the shareholders facing a total loss of 11% per year over five years. We realise that Baron Rothschild has said investors should "buy when there is blood on the streets", but we caution that investors should first be sure they are buying a high quality business. It's always interesting to track share price performance over the longer term. But to understand DFI Retail Group Holdings better, we need to consider many other factors. For instance, we've identified 4 warning signs for DFI Retail Group Holdings (1 makes us a bit uncomfortable) that you should be aware of.
If you would prefer to check out another company -- one with potentially superior financials -- then do not miss this free list of companies that have proven they can grow earnings.
Please note, the market returns quoted in this article reflect the market weighted average returns of stocks that currently trade on SG exchanges.
Have feedback on this article? Concerned about the content? Get in touch with us directly. Alternatively, email editorial-team (at) simplywallst.com.
This article by Simply Wall St is general in nature. We provide commentary based on historical data and analyst forecasts only using an unbiased methodology and our articles are not intended to be financial advice. It does not constitute a recommendation to buy or sell any stock, and does not take account of your objectives, or your financial situation. We aim to bring you long-term focused analysis driven by fundamental data. Note that our analysis may not factor in the latest price-sensitive company announcements or qualitative material. Simply Wall St has no position in any stocks mentioned.
Join A Paid User Research Session
You’ll receive a US$30 Amazon Gift card for 1 hour of your time while helping us build better investing tools for the individual investors like yourself. Sign up here
