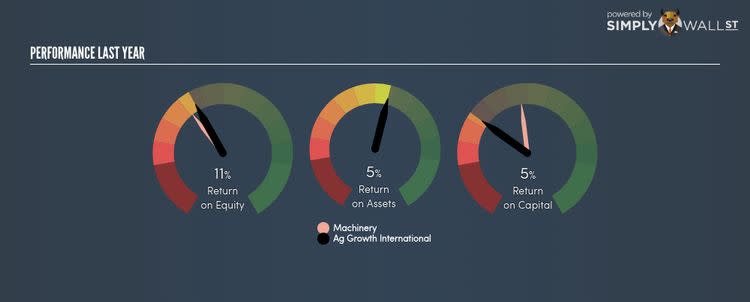
How Did Ag Growth International Inc’s (TSX:AFN) 11.31% ROE Fare Against The Industry?

With an ROE of 11.31%, Ag Growth International Inc (TSX:AFN) outpaced its own industry which delivered a less exciting 9.89% over the past year. On the surface, this looks fantastic since we know that AFN has made large profits from little equity capital; however, ROE doesn’t tell us if management have borrowed heavily to make this happen. Today, we’ll take a closer look at some factors like financial leverage to see how sustainable AFN’s ROE is. Check out our latest analysis for Ag Growth International
What you must know about ROE
Return on Equity (ROE) is a measure of AFN’s profit relative to its shareholders’ equity. For example, if AFN invests CA$1 in the form of equity, it will generate CA$0.11 in earnings from this. While a higher ROE is preferred in most cases, there are several other factors we should consider before drawing any conclusions.
Return on Equity = Net Profit ÷ Shareholders Equity
Returns are usually compared to costs to measure the efficiency of capital. AFN’s cost of equity is 10.07%. Given a positive discrepancy of 1.24% between return and cost, this indicates that AFN pays less for its capital than what it generates in return, which is a sign of capital efficiency. ROE can be dissected into three distinct ratios: net profit margin, asset turnover, and financial leverage. This is called the Dupont Formula:
Dupont Formula
ROE = profit margin × asset turnover × financial leverage
ROE = (annual net profit ÷ sales) × (sales ÷ assets) × (assets ÷ shareholders’ equity)
ROE = annual net profit ÷ shareholders’ equity
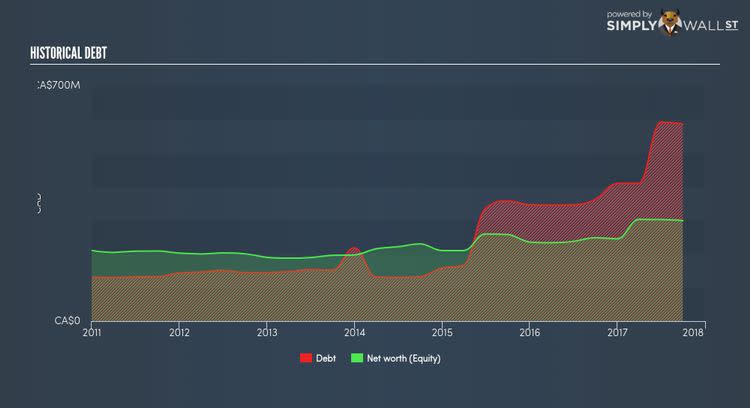
The first component is profit margin, which measures how much of sales is retained after the company pays for all its expenses. Asset turnover shows how much revenue AFN can generate with its current asset base. Finally, financial leverage will be our main focus today. It shows how much of assets are funded by equity and can show how sustainable AFN’s capital structure is. Since ROE can be artificially increased through excessive borrowing, we should check AFN’s historic debt-to-equity ratio. At 195.92%, AFN’s debt-to-equity ratio appears relatively high and indicates the above-average ROE is generated by significant leverage levels.
What this means for you:
Are you a shareholder? AFN’s ROE is impressive relative to the industry average and also covers its cost of equity. However, with debt capital in excess of equity, ROE might be inflated by the use of debt funding, which is something you should be aware of before buying more AFN shares. If you’re looking for new ideas for high-returning stocks, you should take a look at our free platform to see the list of stocks with Return on Equity over 20%.
Are you a potential investor? If you are considering investing in AFN, looking at ROE on its own is not enough to make a well-informed decision. I recommend you do additional fundamental analysis by looking through our most recent infographic report on Ag Growth International to help you make a more informed investment decision.
To help readers see pass the short term volatility of the financial market, we aim to bring you a long-term focused research analysis purely driven by fundamental data. Note that our analysis does not factor in the latest price sensitive company announcements.
The author is an independent contributor and at the time of publication had no position in the stocks mentioned.
