How Did Cedar Realty Trust Inc’s (NYSE:CDR) 2.97% ROE Fare Against The Industry?

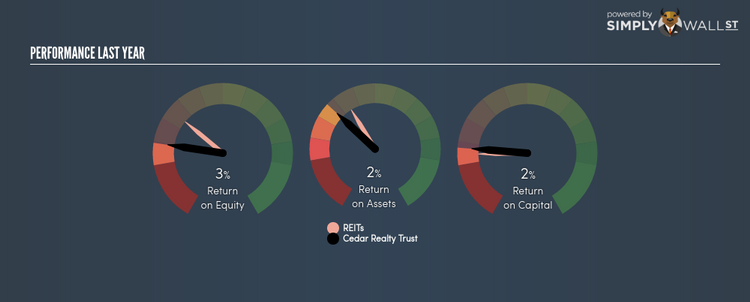
Cedar Realty Trust Inc (NYSE:CDR) generated a below-average return on equity of 2.97% in the past 12 months, while its industry returned 7.96%. An investor may attribute an inferior ROE to a relatively inefficient performance, and whilst this can often be the case, knowing the nuts and bolts of the ROE calculation may change that perspective and give you a deeper insight into CDR’s past performance. Metrics such as financial leverage can impact the level of ROE which in turn can affect the sustainability of CDR’s returns. Let me show you what I mean by this. See our latest analysis for Cedar Realty Trust
What you must know about ROE
Return on Equity (ROE) weighs Cedar Realty Trust’s profit against the level of its shareholders’ equity. For example, if the company invests $1 in the form of equity, it will generate $0.03 in earnings from this. Generally speaking, a higher ROE is preferred; however, there are other factors we must also consider before making any conclusions.
Return on Equity = Net Profit ÷ Shareholders Equity
ROE is assessed against cost of equity, which is measured using the Capital Asset Pricing Model (CAPM) – but let’s not dive into the details of that today. For now, let’s just look at the cost of equity number for Cedar Realty Trust, which is 9.23%. Since Cedar Realty Trust’s return does not cover its cost, with a difference of -6.26%, this means its current use of equity is not efficient and not sustainable. Very simply, Cedar Realty Trust pays more for its capital than what it generates in return. ROE can be split up into three useful ratios: net profit margin, asset turnover, and financial leverage. This is called the Dupont Formula:
Dupont Formula
ROE = profit margin × asset turnover × financial leverage
ROE = (annual net profit ÷ sales) × (sales ÷ assets) × (assets ÷ shareholders’ equity)
ROE = annual net profit ÷ shareholders’ equity
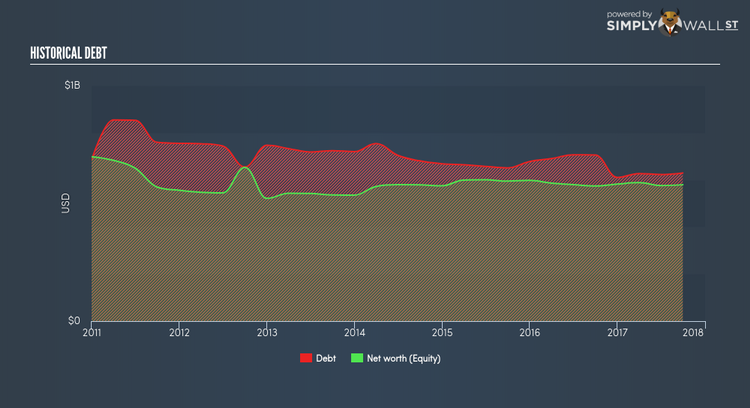
Basically, profit margin measures how much of revenue trickles down into earnings which illustrates how efficient the business is with its cost management. Asset turnover shows how much revenue Cedar Realty Trust can generate with its current asset base. And finally, financial leverage is simply how much of assets are funded by equity, which exhibits how sustainable the company’s capital structure is. Since ROE can be artificially increased through excessive borrowing, we should check Cedar Realty Trust’s historic debt-to-equity ratio. The debt-to-equity ratio currently stands at a balanced 108.60%, meaning the ROE is a result of its capacity to produce profit growth without a huge debt burden.
What this means for you:
Are you a shareholder? CDR’s below-industry ROE is disappointing, furthermore, its returns were not even high enough to cover its own cost of equity. However, investors shouldn’t despair since ROE is not inflated by excessive debt, which means CDR still has room to improve shareholder returns by raising debt to fund new investments. If you’re looking for new ideas for high-returning stocks, you should take a look at our free platform to see the list of stocks with Return on Equity over 20%.
Are you a potential investor? If CDR has been on your watch list for a while, making an investment decision based on ROE alone is unwise. I recommend you do additional fundamental analysis by looking through our most recent infographic report on Cedar Realty Trust to help you make a more informed investment decision.
To help readers see pass the short term volatility of the financial market, we aim to bring you a long-term focused research analysis purely driven by fundamental data. Note that our analysis does not factor in the latest price sensitive company announcements.
The author is an independent contributor and at the time of publication had no position in the stocks mentioned.
