How Did Hopson Development Holdings Limited’s (HKG:754) 8.77% ROE Fare Against The Industry?

I am writing today to help inform people who are new to the stock market and looking to gauge the potential return on investment in Hopson Development Holdings Limited (HKG:754).
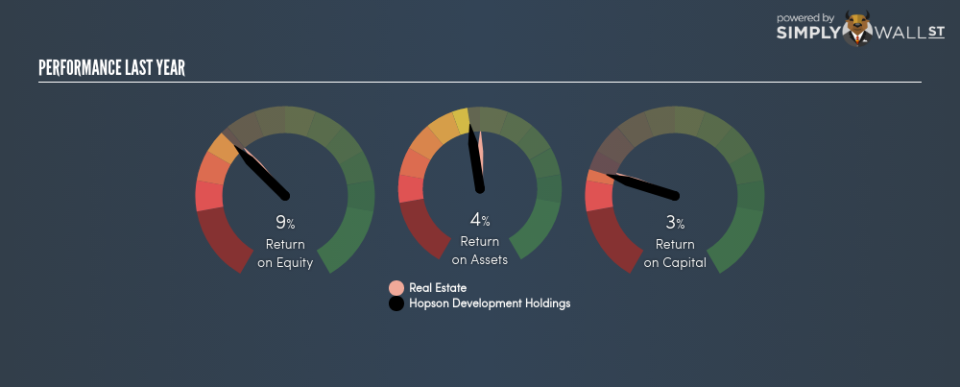
Hopson Development Holdings Limited’s (HKG:754) most recent return on equity was a substandard 8.77% relative to its industry performance of 9.52% over the past year. Though 754’s recent performance is underwhelming, it is useful to understand what ROE is made up of and how it should be interpreted. Knowing these components can change your views on 754’s below-average returns. I will take you through how metrics such as financial leverage impact ROE which may affect the overall sustainability of 754’s returns. See our latest analysis for Hopson Development Holdings
Breaking down Return on Equity
Return on Equity (ROE) is a measure of Hopson Development Holdings’s profit relative to its shareholders’ equity. For example, if the company invests HK$1 in the form of equity, it will generate HK$0.088 in earnings from this. In most cases, a higher ROE is preferred; however, there are many other factors we must consider prior to making any investment decisions.
Return on Equity = Net Profit ÷ Shareholders Equity
ROE is assessed against cost of equity, which is measured using the Capital Asset Pricing Model (CAPM) – but let’s not dive into the details of that today. For now, let’s just look at the cost of equity number for Hopson Development Holdings, which is 17.80%. Given a discrepancy of -9.02% between return and cost, this indicated that Hopson Development Holdings may be paying more for its capital than what it’s generating in return. ROE can be broken down into three different ratios: net profit margin, asset turnover, and financial leverage. This is called the Dupont Formula:
Dupont Formula
ROE = profit margin × asset turnover × financial leverage
ROE = (annual net profit ÷ sales) × (sales ÷ assets) × (assets ÷ shareholders’ equity)
ROE = annual net profit ÷ shareholders’ equity
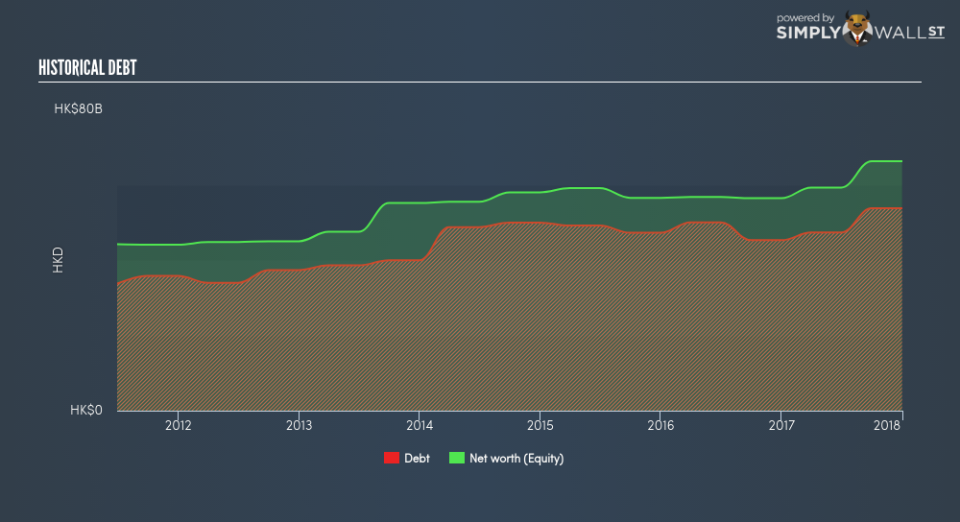
The first component is profit margin, which measures how much of sales is retained after the company pays for all its expenses. Asset turnover reveals how much revenue can be generated from Hopson Development Holdings’s asset base. Finally, financial leverage will be our main focus today. It shows how much of assets are funded by equity and can show how sustainable the company’s capital structure is. Since ROE can be inflated by excessive debt, we need to examine Hopson Development Holdings’s debt-to-equity level. Currently the debt-to-equity ratio stands at a reasonable 81.12%, which means its ROE is driven by its ability to grow its profit without a significant debt burden.
Next Steps:
ROE is one of many ratios which meaningfully dissects financial statements, which illustrates the quality of a company. Hopson Development Holdings’s below-industry ROE is disappointing, furthermore, its returns were not even high enough to cover its own cost of equity. Although, its appropriate level of leverage means investors can be more confident in the sustainability of Hopson Development Holdings’s return with a possible increase should the company decide to increase its debt levels. ROE is a helpful signal, but it is definitely not sufficient on its own to make an investment decision.
For Hopson Development Holdings, I’ve put together three essential aspects you should look at:
Financial Health: Does it have a healthy balance sheet? Take a look at our free balance sheet analysis with six simple checks on key factors like leverage and risk.
Future Earnings: How does Hopson Development Holdings’s growth rate compare to its peers and the wider market? Dig deeper into the analyst consensus number for the upcoming years by interacting with our free analyst growth expectation chart.
Other High-Growth Alternatives : Are there other high-growth stocks you could be holding instead of Hopson Development Holdings? Explore our interactive list of stocks with large growth potential to get an idea of what else is out there you may be missing!
To help readers see pass the short term volatility of the financial market, we aim to bring you a long-term focused research analysis purely driven by fundamental data. Note that our analysis does not factor in the latest price sensitive company announcements.
The author is an independent contributor and at the time of publication had no position in the stocks mentioned.
