Did Keyera Corp (TSX:KEY) Create Value For Shareholders?

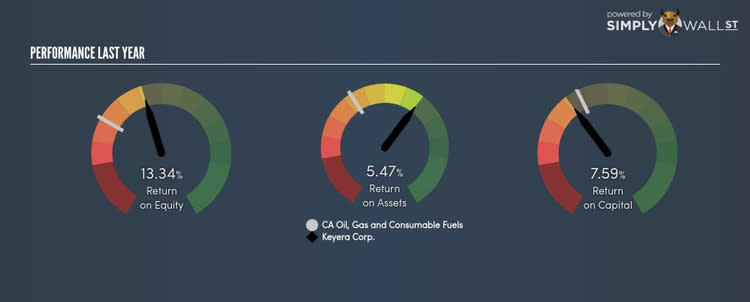
Keyera Corp (TSX:KEY) delivered an ROE of 13.34% over the past 12 months, which is an impressive feat relative to its industry average of 6.42% during the same period. On the surface, this looks fantastic since we know that KEY has made large profits from little equity capital; however, ROE doesn’t tell us if management have borrowed heavily to make this happen. In this article, we’ll closely examine some factors like financial leverage to evaluate the sustainability of KEY’s ROE. View our latest analysis for Keyera
What you must know about ROE
Return on Equity (ROE) is a measure of KEY’s profit relative to its shareholders’ equity. For example, if KEY invests $1 in the form of equity, it will generate $0.13 in earnings from this. While a higher ROE is preferred in most cases, there are several other factors we should consider before drawing any conclusions.
Return on Equity = Net Profit ÷ Shareholders Equity
ROE is assessed against cost of equity, which is measured using the Capital Asset Pricing Model (CAPM) – but let’s not dive into the details of that today. For now, let’s just look at the cost of equity number for KEY, which is 8.49%. Given a positive discrepancy of 4.84% between return and cost, this indicates that KEY pays less for its capital than what it generates in return, which is a sign of capital efficiency. ROE can be split up into three useful ratios: net profit margin, asset turnover, and financial leverage. This is called the Dupont Formula:
Dupont Formula
ROE = profit margin × asset turnover × financial leverage
ROE = (annual net profit ÷ sales) × (sales ÷ assets) × (assets ÷ shareholders’ equity)
ROE = annual net profit ÷ shareholders’ equity
Essentially, profit margin shows how much money the company makes after paying for all its expenses. The other component, asset turnover, illustrates how much revenue KEY can make from its asset base. And finally, financial leverage is simply how much of assets are funded by equity, which exhibits how sustainable KEY’s capital structure is. Since ROE can be inflated by excessive debt, we need to examine KEY’s debt-to-equity level. Currently the debt-to-equity ratio stands at a balanced 98.46%, which means its above-average ROE is driven by its ability to grow its profit without a significant debt burden.

What this means for you:
Are you a shareholder? KEY exhibits a strong ROE against its peers, as well as sufficient returns to cover its cost of equity. Since ROE is not inflated by excessive debt, it might be a good time to add more of KEY to your portfolio if your personal research is confirming what the ROE is telling you.
Are you a potential investor? If KEY has been on your watch list for a while, making an investment decision based on ROE alone is unwise. I recommend you do additional fundamental analysis by looking through our most recent infographic report on Keyera to help you make a more informed investment decision. If you are not interested in KEY anymore, you can use our free platform to see our list of stocks with Return on Equity over 20%.
To help readers see pass the short term volatility of the financial market, we aim to bring you a long-term focused research analysis purely driven by fundamental data. Note that our analysis does not factor in the latest price sensitive company announcements.
The author is an independent contributor and at the time of publication had no position in the stocks mentioned.
