Did MetLife Inc (MET) Create Value For Investors Over The Past Year?

MetLife Inc (NYSE:MET) generated a below-average return on equity of 0.27% in the past 12 months, while its industry returned 8.79%. An investor may attribute an inferior ROE to a relatively inefficient performance, and whilst this can often be the case, knowing the nuts and bolts of the ROE calculation may change that perspective and give you a deeper insight into MET's past performance. Today I will look at how components such as financial leverage can influence ROE which may impact the sustainability of MET's returns. View our latest analysis for MetLife
Breaking down ROE — the mother of all ratios
Return on Equity (ROE) is a measure of MET’s profit relative to its shareholders’ equity. For example, if MET invests $1 in the form of equity, it will generate $0 in earnings from this. While a higher ROE is preferred in most cases, there are several other factors we should consider before drawing any conclusions.
Return on Equity = Net Profit ÷ Shareholders Equity
Returns are usually compared to costs to measure the efficiency of capital. MET’s cost of equity is 8.98%. This means MET’s returns actually do not cover its own cost of equity, with a discrepancy of -8.71%. This isn’t sustainable as it implies, very simply, that the company pays more for its capital than what it generates in return. ROE can be broken down into three different ratios: net profit margin, asset turnover, and financial leverage. This is called the Dupont Formula:
Dupont Formula
ROE = profit margin × asset turnover × financial leverage
ROE = (annual net profit ÷ sales) × (sales ÷ assets) × (assets ÷ shareholders’ equity)
ROE = annual net profit ÷ shareholders’ equity

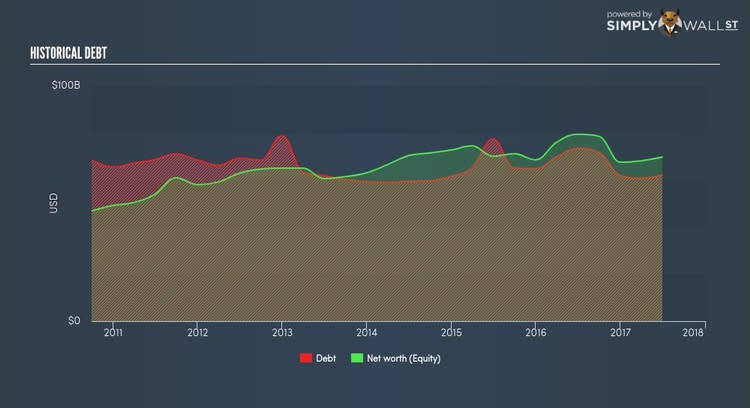
Essentially, profit margin shows how much money the company makes after paying for all its expenses. The other component, asset turnover, illustrates how much revenue MET can make from its asset base. And finally, financial leverage is simply how much of assets are funded by equity, which exhibits how sustainable MET’s capital structure is. Since financial leverage can artificially inflate ROE, we need to look at how much debt MET currently has. At 88.98%, MET’s debt-to-equity ratio appears sensible and indicates its ROE is generated from its capacity to increase profit without a large debt burden.
What this means for you:
Are you a shareholder? MET exhibits a weak ROE against its peers, as well as insufficient levels to cover its own cost of equity this year. Since its existing ROE is not fuelled by unsustainable debt, investors shouldn’t give up as MET still has capacity to improve shareholder returns by borrowing to invest in new projects in the future.
Are you a potential investor? If MET has been on your watch list for a while, making an investment decision based on ROE alone is unwise. I recommend you do additional fundamental analysis by looking through our most recent infographic report on MetLife to help you make a more informed investment decision. If you are not interested in MET anymore, you can use our free platform to see our list of stocks with Return on Equity over 20%.
To help readers see pass the short term volatility of the financial market, we aim to bring you a long-term focused research analysis purely driven by fundamental data. Note that our analysis does not factor in the latest price sensitive company announcements.
The author is an independent contributor and at the time of publication had no position in the stocks mentioned.
