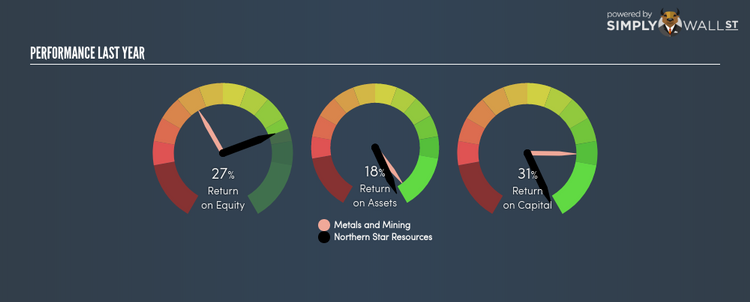
How Did Northern Star Resources Limited’s (ASX:NST) 27.13% ROE Fare Against The Industry?

With an ROE of 27.13%, Northern Star Resources Limited (ASX:NST) outpaced its own industry which delivered a less exciting 11.24% over the past year. While the impressive ratio tells us that NST has made significant profits from little equity capital, ROE doesn’t tell us if NST has borrowed debt to make this happen. Today, we’ll take a closer look at some factors like financial leverage to see how sustainable NST’s ROE is. Check out our latest analysis for Northern Star Resources
Breaking down Return on Equity
Firstly, Return on Equity, or ROE, is simply the percentage of last years’ earning against the book value of shareholders’ equity. For example, if the company invests A$1 in the form of equity, it will generate A$0.27 in earnings from this. Generally speaking, a higher ROE is preferred; however, there are other factors we must also consider before making any conclusions.
Return on Equity = Net Profit ÷ Shareholders Equity
ROE is assessed against cost of equity, which is measured using the Capital Asset Pricing Model (CAPM) – but let’s not dive into the details of that today. For now, let’s just look at the cost of equity number for Northern Star Resources, which is 9.44%. Since Northern Star Resources’s return covers its cost in excess of 17.69%, its use of equity capital is efficient and likely to be sustainable. Simply put, Northern Star Resources pays less for its capital than what it generates in return. ROE can be broken down into three different ratios: net profit margin, asset turnover, and financial leverage. This is called the Dupont Formula:
Dupont Formula
ROE = profit margin × asset turnover × financial leverage
ROE = (annual net profit ÷ sales) × (sales ÷ assets) × (assets ÷ shareholders’ equity)
ROE = annual net profit ÷ shareholders’ equity
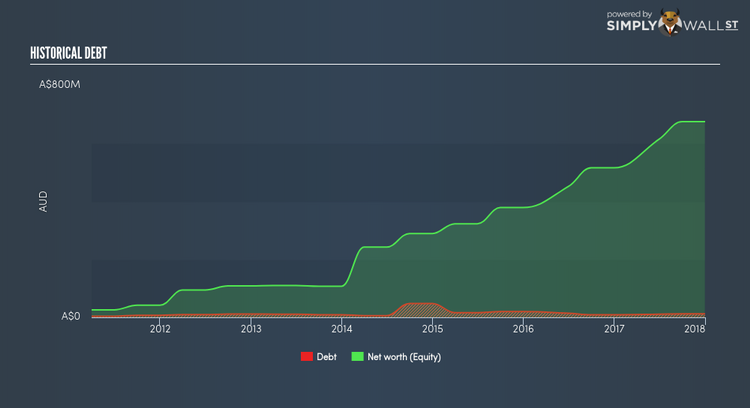
The first component is profit margin, which measures how much of sales is retained after the company pays for all its expenses. The other component, asset turnover, illustrates how much revenue Northern Star Resources can make from its asset base. And finally, financial leverage is simply how much of assets are funded by equity, which exhibits how sustainable the company’s capital structure is. Since ROE can be artificially increased through excessive borrowing, we should check Northern Star Resources’s historic debt-to-equity ratio. The debt-to-equity ratio currently stands at a low 1.83%, meaning the above-average ROE is due to its capacity to produce profit growth without a huge debt burden.
Next Steps:
ROE is a simple yet informative ratio, illustrating the various components that each measure the quality of the overall stock. Northern Star Resources’s above-industry ROE is encouraging, and is also in excess of its cost of equity. ROE is not likely to be inflated by excessive debt funding, giving shareholders more conviction in the sustainability of high returns. ROE is a helpful signal, but it is definitely not sufficient on its own to make an investment decision.
For Northern Star Resources, I’ve compiled three key aspects you should further research:
Financial Health: Does it have a healthy balance sheet? Take a look at our free balance sheet analysis with six simple checks on key factors like leverage and risk.
Valuation: What is Northern Star Resources worth today? Is the stock undervalued, even when its growth outlook is factored into its intrinsic value? The intrinsic value infographic in our free research report helps visualize whether Northern Star Resources is currently mispriced by the market.
Other High-Growth Alternatives : Are there other high-growth stocks you could be holding instead of Northern Star Resources? Explore our interactive list of stocks with large growth potential to get an idea of what else is out there you may be missing!
To help readers see pass the short term volatility of the financial market, we aim to bring you a long-term focused research analysis purely driven by fundamental data. Note that our analysis does not factor in the latest price sensitive company announcements.
The author is an independent contributor and at the time of publication had no position in the stocks mentioned.
