Did Severn Bancorp Inc (NASDAQ:SVBI) Create Value For Investors Over The Past Year?

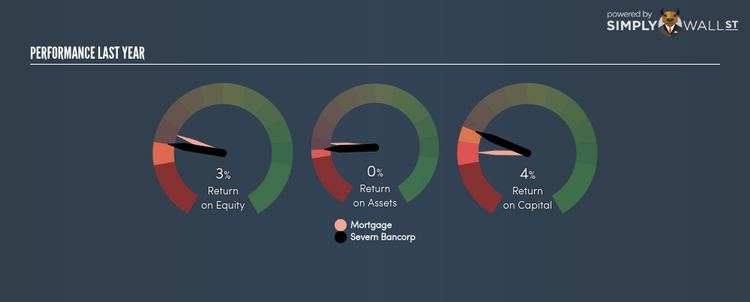
Severn Bancorp Inc’s (NASDAQ:SVBI) most recent return on equity was a substandard 3.09% relative to its industry performance of 4.97% over the past year. Though SVBI’s recent performance is underwhelming, it is useful to understand what ROE is made up of and how it should be interpreted. Knowing these components can change your views on SVBI’s below-average returns. I will take you through how metrics such as financial leverage impact ROE which may affect the overall sustainability of SVBI’s returns. View our latest analysis for Severn Bancorp
Breaking down ROE — the mother of all ratios
Return on Equity (ROE) is a measure of Severn Bancorp’s profit relative to its shareholders’ equity. An ROE of 3.09% implies $0.03 returned on every $1 invested. In most cases, a higher ROE is preferred; however, there are many other factors we must consider prior to making any investment decisions.
Return on Equity = Net Profit ÷ Shareholders Equity
ROE is assessed against cost of equity, which is measured using the Capital Asset Pricing Model (CAPM) – but let’s not dive into the details of that today. For now, let’s just look at the cost of equity number for Severn Bancorp, which is 9.72%. Given a discrepancy of -6.62% between return and cost, this indicated that Severn Bancorp may be paying more for its capital than what it’s generating in return. ROE can be broken down into three different ratios: net profit margin, asset turnover, and financial leverage. This is called the Dupont Formula:
Dupont Formula
ROE = profit margin × asset turnover × financial leverage
ROE = (annual net profit ÷ sales) × (sales ÷ assets) × (assets ÷ shareholders’ equity)
ROE = annual net profit ÷ shareholders’ equity
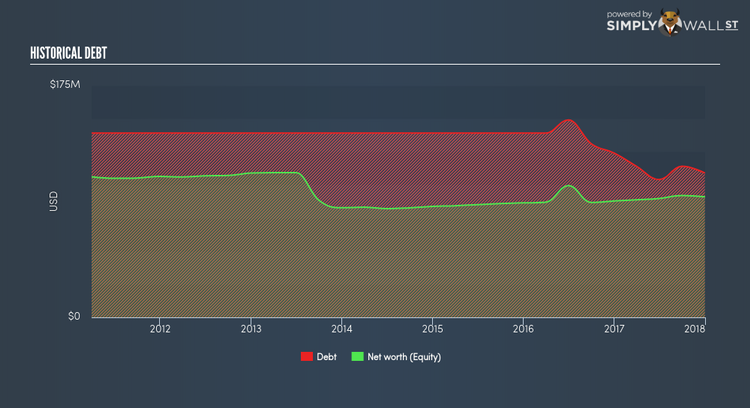
The first component is profit margin, which measures how much of sales is retained after the company pays for all its expenses. Asset turnover reveals how much revenue can be generated from Severn Bancorp’s asset base. And finally, financial leverage is simply how much of assets are funded by equity, which exhibits how sustainable the company’s capital structure is. Since ROE can be artificially increased through excessive borrowing, we should check Severn Bancorp’s historic debt-to-equity ratio. At 119.78%, Severn Bancorp’s debt-to-equity ratio appears balanced and indicates its ROE is generated from its capacity to increase profit without a large debt burden.
Next Steps:
ROE is a simple yet informative ratio, illustrating the various components that each measure the quality of the overall stock. Severn Bancorp’s ROE is underwhelming relative to the industry average, and its returns were also not strong enough to cover its own cost of equity. Although, its appropriate level of leverage means investors can be more confident in the sustainability of Severn Bancorp’s return with a possible increase should the company decide to increase its debt levels. Although ROE can be a useful metric, it is only a small part of diligent research.
For Severn Bancorp, I’ve put together three important aspects you should further examine:
Financial Health: Does it have a healthy balance sheet? Take a look at our free balance sheet analysis with six simple checks on key factors like leverage and risk.
Valuation: What is Severn Bancorp worth today? Is the stock undervalued, even when its growth outlook is factored into its intrinsic value? The intrinsic value infographic in our free research report helps visualize whether Severn Bancorp is currently mispriced by the market.
Other High-Growth Alternatives : Are there other high-growth stocks you could be holding instead of Severn Bancorp? Explore our interactive list of stocks with large growth potential to get an idea of what else is out there you may be missing!
To help readers see pass the short term volatility of the financial market, we aim to bring you a long-term focused research analysis purely driven by fundamental data. Note that our analysis does not factor in the latest price sensitive company announcements.
The author is an independent contributor and at the time of publication had no position in the stocks mentioned.
