Did SPAR Group Inc (SGRP) Create Value For Investors Over The Past Year?

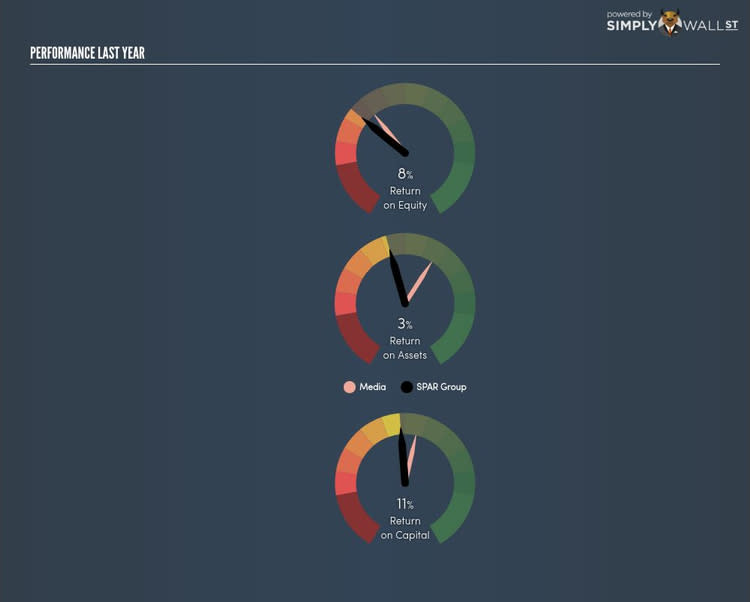
SPAR Group Inc’s (NASDAQ:SGRP) most recent return on equity was a substandard 7.90% relative to its industry performance of 9.82% over the past year. Though SGRP's recent performance is underwhelming, it is useful to understand what ROE is made up of and how it should be interpreted. Knowing these components can change your views on SGRP's below-average returns. Metrics such as financial leverage can impact the level of ROE which in turn can affect the sustainability of SGRP's returns. Let me show you what I mean by this. See our latest analysis for SGRP
What you must know about ROE
Return on Equity (ROE) is a measure of SGRP’s profit relative to its shareholders’ equity. For example, if SGRP invests $1 in the form of equity, it will generate $0.08 in earnings from this. While a higher ROE is preferred in most cases, there are several other factors we should consider before drawing any conclusions.
Return on Equity = Net Profit ÷ Shareholders Equity
ROE is measured against cost of equity in order to determine the efficiency of SGRP’s equity capital deployed. Its cost of equity is 12.17%. This means SGRP’s returns actually do not cover its own cost of equity, with a discrepancy of -4.27%. This isn’t sustainable as it implies, very simply, that the company pays more for its capital than what it generates in return. ROE can be split up into three useful ratios: net profit margin, asset turnover, and financial leverage. This is called the Dupont Formula:
Dupont Formula
ROE = profit margin × asset turnover × financial leverage
ROE = (annual net profit ÷ sales) × (sales ÷ assets) × (assets ÷ shareholders’ equity)
ROE = annual net profit ÷ shareholders’ equity
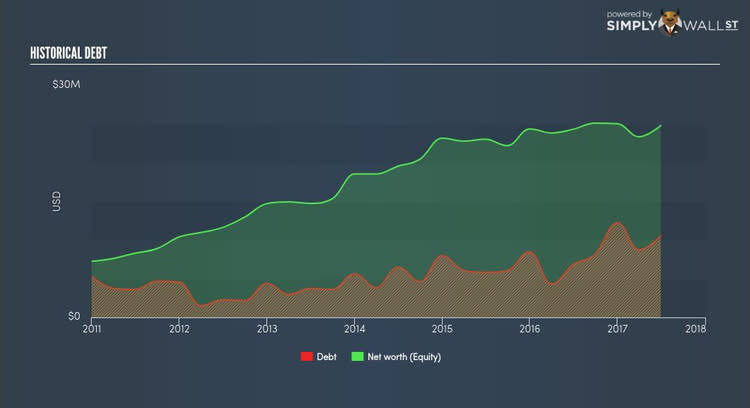
Essentially, profit margin shows how much money the company makes after paying for all its expenses. Asset turnover reveals how much revenue can be generated from SGRP’s asset base. Finally, financial leverage will be our main focus today. It shows how much of assets are funded by equity and can show how sustainable SGRP’s capital structure is. Since financial leverage can artificially inflate ROE, we need to look at how much debt SGRP currently has. The debt-to-equity ratio currently stands at a low 42.39%, meaning SGRP still has headroom to borrow debt to increase profits.
What this means for you:
Are you a shareholder? SGRP’s ROE is underwhelming relative to the industry average, and its returns were also not strong enough to cover its own cost of equity. Since its existing ROE is not fuelled by unsustainable debt, investors shouldn’t give up as SGRP still has capacity to improve shareholder returns by borrowing to invest in new projects in the future. If you're looking for new ideas for high-returning stocks, you should take a look at our free platform to see the list of stocks with Return on Equity over 20%.
Are you a potential investor? If SGRP has been on your watch list for a while, making an investment decision based on ROE alone is unwise. I recommend you do additional fundamental analysis by looking through our most recent infographic report on SPAR Group to help you make a more informed investment decision.
To help readers see pass the short term volatility of the financial market, we aim to bring you a long-term focused research analysis purely driven by fundamental data. Note that our analysis does not factor in the latest price sensitive company announcements.
The author is an independent contributor and at the time of publication had no position in the stocks mentioned.
