Dime Community Bancshares Inc's Dividend Analysis
Unveiling the Dividend Dynamics of Dime Community Bancshares Inc
Dime Community Bancshares Inc (NASDAQ:DCOM) recently announced a dividend of $0.25 per share, payable on 2024-01-24, with the ex-dividend date set for 2024-01-16. As investors look forward to this upcoming payment, the spotlight also shines on the company's dividend history, yield, and growth rates. Using the data from GuruFocus, let's look into Dime Community Bancshares Inc's dividend performance and assess its sustainability.
What Does Dime Community Bancshares Inc Do?
This Powerful Chart Made Peter Lynch 29% A Year For 13 Years
How to calculate the intrinsic value of a stock?
Dime Community Bancshares Inc operates as a holding company. It gathers deposits from customers within its market area and via the internet, and invests them in multifamily residential, commercial real estate, commercial and industrial (C&I) loans, and one-to-four family residential real estate loans, as well as mortgage-backed securities, obligations of the U.S. government and government-sponsored enterprises (GSEs), and corporate debt and equity securities.

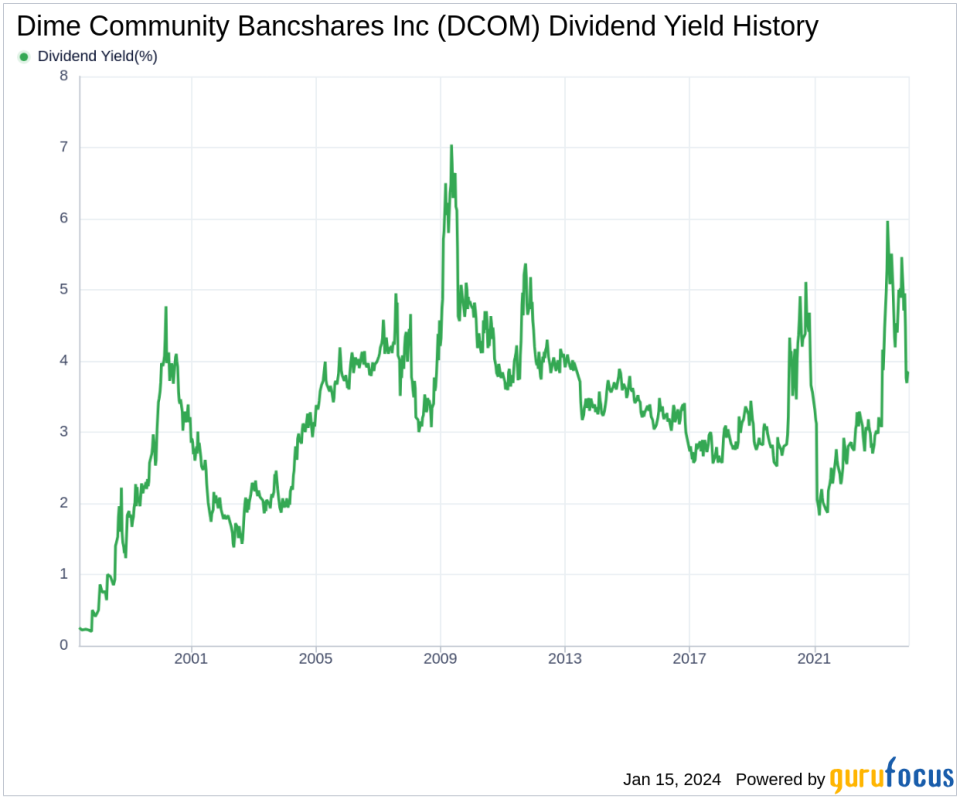
A Glimpse at Dime Community Bancshares Inc's Dividend History
Dime Community Bancshares Inc has maintained a consistent dividend payment record since 1997. Dividends are currently distributed on a quarterly basis.
Dime Community Bancshares Inc has increased its dividend each year since 1997. The stock is thus listed as a dividend aristocrat, an honor that is given to companies that have increased their dividend each year for at least the past 27 years. Below is a chart showing annual Dividends Per Share for tracking historical trends.
Breaking Down Dime Community Bancshares Inc's Dividend Yield and Growth
As of today, Dime Community Bancshares Inc currently has a 12-month trailing dividend yield of 3.90% and a 12-month forward dividend yield of 3.94%, suggesting an expectation of increased dividend payments over the next 12 months.
Over the past three years, Dime Community Bancshares Inc's annual dividend growth rate was 19.70%. Extended to a five-year horizon, this rate decreased to 13.10% per year. And over the past decade, Dime Community Bancshares Inc's annual dividends per share growth rate stands at 4.50%.
Based on Dime Community Bancshares Inc's dividend yield and five-year growth rate, the 5-year yield on cost of Dime Community Bancshares Inc stock as of today is approximately 7.22%.
The Sustainability Question: Payout Ratio and Profitability
To assess the sustainability of the dividend, one needs to evaluate the company's payout ratio. The dividend payout ratio provides insights into the portion of earnings the company distributes as dividends. A lower ratio suggests that the company retains a significant part of its earnings, thereby ensuring the availability of funds for future growth and unexpected downturns. As of 2023-09-30, Dime Community Bancshares Inc's dividend payout ratio is 0.34.
Dime Community Bancshares Inc's profitability rank, offers an understanding of the company's earnings prowess relative to its peers. GuruFocus ranks Dime Community Bancshares Inc's profitability 6 out of 10 as of 2023-09-30, suggesting fair profitability. The company has reported positive net income for each of year over the past decade, further solidifying its high profitability.
Growth Metrics: The Future Outlook
To ensure the sustainability of dividends, a company must have robust growth metrics. Dime Community Bancshares Inc's growth rank of 6 out of 10 suggests that the company has a fair growth outlook.
Revenue is the lifeblood of any company, and Dime Community Bancshares Inc's revenue per share, combined with the 3-year revenue growth rate, indicates a strong revenue model. Dime Community Bancshares Inc's revenue has increased by approximately 16.40% per year on average, a rate that outperforms approximately 85.4% of global competitors.
The company's 3-year EPS growth rate showcases its capability to grow its earnings, a critical component for sustaining dividends in the long run. During the past three years, Dime Community Bancshares Inc's earnings increased by approximately 30.70% per year on average, a rate that outperforms approximately 87.45% of global competitors.
Lastly, the company's 5-year EBITDA growth rate of 27.70%, which outperforms approximately 90.78% of global competitors.
Concluding Thoughts on Dime Community Bancshares Inc's Dividend Fortitude
Concluding our analysis of Dime Community Bancshares Inc, it becomes evident that the company not only has a commendable dividend history but also exhibits a strong commitment to maintaining and growing its dividends. The company's prudent payout ratio, combined with its solid profitability and favorable growth metrics, suggests that Dime Community Bancshares Inc is well-positioned to continue rewarding its shareholders with attractive dividend payments. Investors looking for steady income streams might find Dime Community Bancshares Inc an intriguing option, given its consistent dividend aristocrat status and promising future prospects. Will Dime Community Bancshares Inc continue its dividend excellence, and how might its strategic initiatives further bolster its financial strength? These are questions value investors may consider as they contemplate the addition of Dime Community Bancshares Inc to their portfolios.
GuruFocus Premium users can screen for high-dividend yield stocks using the High Dividend Yield Screener.
This article, generated by GuruFocus, is designed to provide general insights and is not tailored financial advice. Our commentary is rooted in historical data and analyst projections, utilizing an impartial methodology, and is not intended to serve as specific investment guidance. It does not formulate a recommendation to purchase or divest any stock and does not consider individual investment objectives or financial circumstances. Our objective is to deliver long-term, fundamental data-driven analysis. Be aware that our analysis might not incorporate the most recent, price-sensitive company announcements or qualitative information. GuruFocus holds no position in the stocks mentioned herein.
This article first appeared on GuruFocus.
