Is discoverIE Group plc's (LON:DSCV) Stock On A Downtrend As A Result Of Its Poor Financials?
With its stock down 26% over the past three months, it is easy to disregard discoverIE Group (LON:DSCV). To decide if this trend could continue, we decided to look at its weak fundamentals as they shape the long-term market trends. Specifically, we decided to study discoverIE Group's ROE in this article.
Return on equity or ROE is an important factor to be considered by a shareholder because it tells them how effectively their capital is being reinvested. In other words, it is a profitability ratio which measures the rate of return on the capital provided by the company's shareholders.
View our latest analysis for discoverIE Group
How To Calculate Return On Equity?
The formula for return on equity is:
Return on Equity = Net Profit (from continuing operations) ÷ Shareholders' Equity
So, based on the above formula, the ROE for discoverIE Group is:
7.0% = UK£21m ÷ UK£304m (Based on the trailing twelve months to March 2023).
The 'return' refers to a company's earnings over the last year. Another way to think of that is that for every £1 worth of equity, the company was able to earn £0.07 in profit.
What Is The Relationship Between ROE And Earnings Growth?
Thus far, we have learned that ROE measures how efficiently a company is generating its profits. Depending on how much of these profits the company reinvests or "retains", and how effectively it does so, we are then able to assess a company’s earnings growth potential. Assuming all else is equal, companies that have both a higher return on equity and higher profit retention are usually the ones that have a higher growth rate when compared to companies that don't have the same features.
A Side By Side comparison of discoverIE Group's Earnings Growth And 7.0% ROE
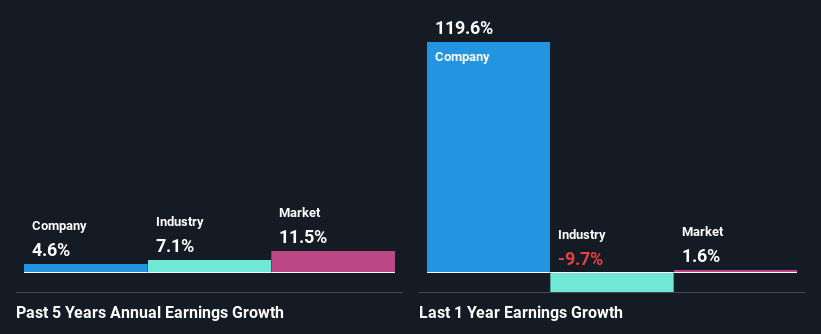
On the face of it, discoverIE Group's ROE is not much to talk about. We then compared the company's ROE to the broader industry and were disappointed to see that the ROE is lower than the industry average of 14%. Thus, the low net income growth of 4.6% seen by discoverIE Group over the past five years could probably be the result of the low ROE.
We then compared discoverIE Group's net income growth with the industry and found that the company's growth figure is lower than the average industry growth rate of 7.1% in the same 5-year period, which is a bit concerning.
Earnings growth is an important metric to consider when valuing a stock. What investors need to determine next is if the expected earnings growth, or the lack of it, is already built into the share price. By doing so, they will have an idea if the stock is headed into clear blue waters or if swampy waters await. Is discoverIE Group fairly valued compared to other companies? These 3 valuation measures might help you decide.
Is discoverIE Group Using Its Retained Earnings Effectively?
discoverIE Group has a three-year median payout ratio of 61% (implying that it keeps only 39% of its profits), meaning that it pays out most of its profits to shareholders as dividends, and as a result, the company has seen low earnings growth.
Moreover, discoverIE Group has been paying dividends for at least ten years or more suggesting that management must have perceived that the shareholders prefer dividends over earnings growth. Our latest analyst data shows that the future payout ratio of the company is expected to drop to 34% over the next three years. Accordingly, the expected drop in the payout ratio explains the expected increase in the company's ROE to 14%, over the same period.
Summary
On the whole, discoverIE Group's performance is quite a big let-down. The company has seen a lack of earnings growth as a result of retaining very little profits and whatever little it does retain, is being reinvested at a very low rate of return. The latest industry analyst forecasts show that the company is expected to maintain its current growth rate. Are these analysts expectations based on the broad expectations for the industry, or on the company's fundamentals? Click here to be taken to our analyst's forecasts page for the company.
Have feedback on this article? Concerned about the content? Get in touch with us directly. Alternatively, email editorial-team (at) simplywallst.com.
This article by Simply Wall St is general in nature. We provide commentary based on historical data and analyst forecasts only using an unbiased methodology and our articles are not intended to be financial advice. It does not constitute a recommendation to buy or sell any stock, and does not take account of your objectives, or your financial situation. We aim to bring you long-term focused analysis driven by fundamental data. Note that our analysis may not factor in the latest price-sensitive company announcements or qualitative material. Simply Wall St has no position in any stocks mentioned.
