Does Assured Guaranty Ltd. (NYSE:AGO) Have A Good P/E Ratio?

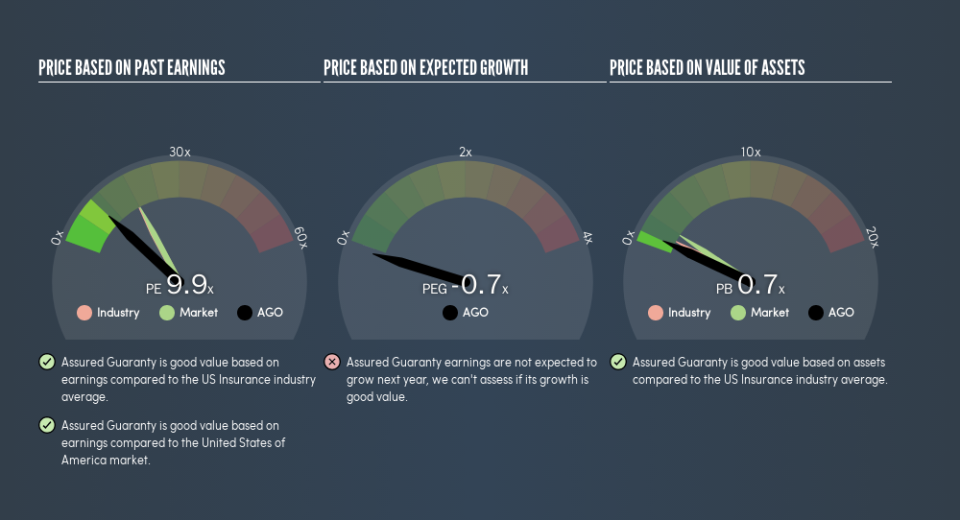
The goal of this article is to teach you how to use price to earnings ratios (P/E ratios). We'll show how you can use Assured Guaranty Ltd.'s (NYSE:AGO) P/E ratio to inform your assessment of the investment opportunity. Assured Guaranty has a P/E ratio of 9.92, based on the last twelve months. That is equivalent to an earnings yield of about 10%.
See our latest analysis for Assured Guaranty
How Do You Calculate A P/E Ratio?
The formula for price to earnings is:
Price to Earnings Ratio = Price per Share ÷ Earnings per Share (EPS)
Or for Assured Guaranty:
P/E of 9.92 = $46.91 ÷ $4.73 (Based on the trailing twelve months to December 2018.)
Is A High P/E Ratio Good?
A higher P/E ratio implies that investors pay a higher price for the earning power of the business. That isn't a good or a bad thing on its own, but a high P/E means that buyers have a higher opinion of the business's prospects, relative to stocks with a lower P/E.
How Growth Rates Impact P/E Ratios
If earnings fall then in the future the 'E' will be lower. Therefore, even if you pay a low multiple of earnings now, that multiple will become higher in the future. A higher P/E should indicate the stock is expensive relative to others -- and that may encourage shareholders to sell.
Assured Guaranty saw earnings per share decrease by 22% last year. But over the longer term (5 years) earnings per share have increased by 1.8%. And over the longer term (3 years) earnings per share have decreased 13% annually. This might lead to low expectations.
Does Assured Guaranty Have A Relatively High Or Low P/E For Its Industry?
The P/E ratio essentially measures market expectations of a company. If you look at the image below, you can see Assured Guaranty has a lower P/E than the average (18.1) in the insurance industry classification.
This suggests that market participants think Assured Guaranty will underperform other companies in its industry. Since the market seems unimpressed with Assured Guaranty, it's quite possible it could surprise on the upside. You should delve deeper. I like to check if company insiders have been buying or selling.
Don't Forget: The P/E Does Not Account For Debt or Bank Deposits
Don't forget that the P/E ratio considers market capitalization. Thus, the metric does not reflect cash or debt held by the company. In theory, a company can lower its future P/E ratio by using cash or debt to invest in growth.
Such expenditure might be good or bad, in the long term, but the point here is that the balance sheet is not reflected by this ratio.
Assured Guaranty's Balance Sheet
Assured Guaranty has net debt worth just 8.3% of its market capitalization. It would probably trade on a higher P/E ratio if it had a lot of cash, but I doubt it is having a big impact.
The Bottom Line On Assured Guaranty's P/E Ratio
Assured Guaranty trades on a P/E ratio of 9.9, which is below the US market average of 18.2. Since it only carries a modest debt load, it's likely the low expectations implied by the P/E ratio arise from the lack of recent earnings growth.
When the market is wrong about a stock, it gives savvy investors an opportunity. If the reality for a company is not as bad as the P/E ratio indicates, then the share price should increase as the market realizes this. So this free visualization of the analyst consensus on future earnings could help you make the right decision about whether to buy, sell, or hold.
Of course you might be able to find a better stock than Assured Guaranty. So you may wish to see this free collection of other companies that have grown earnings strongly.
We aim to bring you long-term focused research analysis driven by fundamental data. Note that our analysis may not factor in the latest price-sensitive company announcements or qualitative material.
If you spot an error that warrants correction, please contact the editor at editorial-team@simplywallst.com. This article by Simply Wall St is general in nature. It does not constitute a recommendation to buy or sell any stock, and does not take account of your objectives, or your financial situation. Simply Wall St has no position in the stocks mentioned. Thank you for reading.
