What Does The Bank of Princeton's (NASDAQ:BPRN) P/E Ratio Tell You?

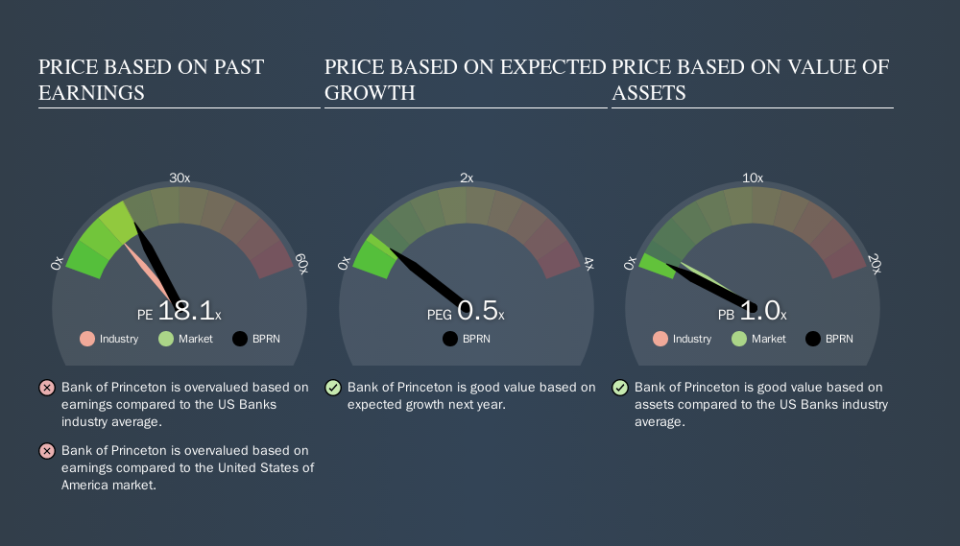
The goal of this article is to teach you how to use price to earnings ratios (P/E ratios). We'll show how you can use The Bank of Princeton's (NASDAQ:BPRN) P/E ratio to inform your assessment of the investment opportunity. Bank of Princeton has a P/E ratio of 18.12, based on the last twelve months. In other words, at today's prices, investors are paying $18.12 for every $1 in prior year profit.
Check out our latest analysis for Bank of Princeton
How Do You Calculate A P/E Ratio?
The formula for P/E is:
Price to Earnings Ratio = Price per Share ÷ Earnings per Share (EPS)
Or for Bank of Princeton:
P/E of 18.12 = $28.56 ÷ $1.58 (Based on the year to June 2019.)
Is A High P/E Ratio Good?
The higher the P/E ratio, the higher the price tag of a business, relative to its trailing earnings. All else being equal, it's better to pay a low price -- but as Warren Buffett said, 'It's far better to buy a wonderful company at a fair price than a fair company at a wonderful price.
How Does Bank of Princeton's P/E Ratio Compare To Its Peers?
One good way to get a quick read on what market participants expect of a company is to look at its P/E ratio. As you can see below, Bank of Princeton has a higher P/E than the average company (12.6) in the banks industry.
Bank of Princeton's P/E tells us that market participants think the company will perform better than its industry peers, going forward. Shareholders are clearly optimistic, but the future is always uncertain. So investors should delve deeper. I like to check if company insiders have been buying or selling.
How Growth Rates Impact P/E Ratios
Companies that shrink earnings per share quickly will rapidly decrease the 'E' in the equation. That means even if the current P/E is low, it will increase over time if the share price stays flat. Then, a higher P/E might scare off shareholders, pushing the share price down.
Bank of Princeton's earnings per share fell by 16% in the last twelve months. And over the longer term (5 years) earnings per share have decreased 3.8% annually. This growth rate might warrant a below average P/E ratio.
Remember: P/E Ratios Don't Consider The Balance Sheet
The 'Price' in P/E reflects the market capitalization of the company. Thus, the metric does not reflect cash or debt held by the company. Theoretically, a business can improve its earnings (and produce a lower P/E in the future) by investing in growth. That means taking on debt (or spending its cash).
While growth expenditure doesn't always pay off, the point is that it is a good option to have; but one that the P/E ratio ignores.
So What Does Bank of Princeton's Balance Sheet Tell Us?
With net cash of US$63m, Bank of Princeton has a very strong balance sheet, which may be important for its business. Having said that, at 33% of its market capitalization the cash hoard would contribute towards a higher P/E ratio.
The Verdict On Bank of Princeton's P/E Ratio
Bank of Princeton's P/E is 18.1 which is about average (18.0) in the US market. While the absence of growth in the last year is probably causing a degree of pessimism, the healthy balance sheet means the company retains potential for future growth. So it's not surprising to see it trade on a P/E roughly in line with the market.
When the market is wrong about a stock, it gives savvy investors an opportunity. As value investor Benjamin Graham famously said, 'In the short run, the market is a voting machine but in the long run, it is a weighing machine. So this free visual report on analyst forecasts could hold the key to an excellent investment decision.
Of course, you might find a fantastic investment by looking at a few good candidates. So take a peek at this free list of companies with modest (or no) debt, trading on a P/E below 20.
We aim to bring you long-term focused research analysis driven by fundamental data. Note that our analysis may not factor in the latest price-sensitive company announcements or qualitative material.
If you spot an error that warrants correction, please contact the editor at editorial-team@simplywallst.com. This article by Simply Wall St is general in nature. It does not constitute a recommendation to buy or sell any stock, and does not take account of your objectives, or your financial situation. Simply Wall St has no position in the stocks mentioned. Thank you for reading.
