How Does CNO Financial Group Inc’s (NYSE:CNO) Earnings Growth Stack Up Against Industry Performance?

After reading CNO Financial Group Inc’s (NYSE:CNO) latest earnings update (30 September 2017), I found it beneficial to look back at how the company has performed in the past and compare this against the most recent numbers. As a long-term investor I tend to pay attention to earnings trend, rather than a single number at one point in time. I also like to compare against an industry benchmark to understand whether CNO has outperformed, or whether it is simply riding an industry wave. Below is a brief commentary on my key takeaways. View our latest analysis for CNO Financial Group
Could CNO beat the long-term trend and outperform its industry?
I like to use the ‘latest twelve-month’ data, which annualizes the latest 6-month earnings release, or some times, the latest annual report is already the most recent financial data. This enables me to assess many different companies in a uniform manner using the latest information. For CNO Financial Group, its most recent earnings (trailing twelve month) is $480.7M, which, relative to the prior year’s figure, has escalated by a significant 83.97%. Since these values are fairly short-term, I have computed an annualized five-year value for CNO Financial Group’s earnings, which stands at $294.5M. This means that, on average, CNO Financial Group has been able to steadily raise its earnings over the past couple of years as well.
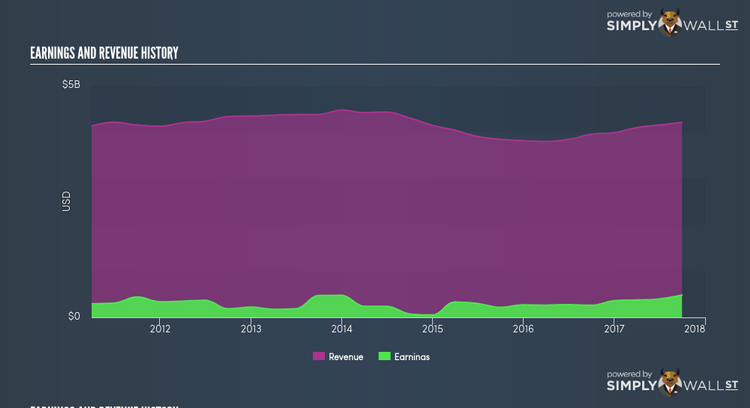
What’s enabled this growth? Let’s see if it is only owing to an industry uplift, or if CNO Financial Group has seen some company-specific growth. Over the last few years, CNO Financial Group expanded bottom-line, while its top-line fell, by efficiently managing its costs. This has caused to a margin expansion and profitability over time. Inspecting growth from a sector-level, the US insurance industry has been growing, albeit, at a subdued single-digit rate of 6.15% in the prior twelve months, and 8.71% over the past five years. This shows that whatever tailwind the industry is profiting from, CNO Financial Group is capable of leveraging this to its advantage.
What does this mean?
CNO Financial Group’s track record can be a valuable insight into its earnings performance, but it certainly doesn’t tell the whole story. While CNO Financial Group has a good historical track record with positive growth and profitability, there’s no certainty that this will extrapolate into the future. I suggest you continue to research CNO Financial Group to get a better picture of the stock by looking at:
1. Future Outlook: What are well-informed industry analysts predicting for CNO’s future growth? Take a look at our free research report of analyst consensus for CNO’s outlook.
2. Financial Health: Is CNO’s operations financially sustainable? Balance sheets can be hard to analyze, which is why we’ve done it for you. Check out our financial health checks here.
3. Other High-Performing Stocks: Are there other stocks that provide better prospects with proven track records? Explore our free list of these great stocks here.
NB: Figures in this article are calculated using data from the trailing twelve months from 30 September 2017. This may not be consistent with full year annual report figures.
To help readers see pass the short term volatility of the financial market, we aim to bring you a long-term focused research analysis purely driven by fundamental data. Note that our analysis does not factor in the latest price sensitive company announcements.
The author is an independent contributor and at the time of publication had no position in the stocks mentioned.
