What Does Compass Minerals International, Inc.'s (NYSE:CMP) P/E Ratio Tell You?

Want to participate in a short research study? Help shape the future of investing tools and you could win a $250 gift card!
The goal of this article is to teach you how to use price to earnings ratios (P/E ratios). To keep it practical, we'll show how Compass Minerals International, Inc.'s (NYSE:CMP) P/E ratio could help you assess the value on offer. Based on the last twelve months, Compass Minerals International's P/E ratio is 30.05. In other words, at today's prices, investors are paying $30.05 for every $1 in prior year profit.
See our latest analysis for Compass Minerals International
How Do You Calculate A P/E Ratio?
The formula for P/E is:
Price to Earnings Ratio = Share Price ÷ Earnings per Share (EPS)
Or for Compass Minerals International:
P/E of 30.05 = $56.1 ÷ $1.87 (Based on the year to March 2019.)
Is A High Price-to-Earnings Ratio Good?
A higher P/E ratio means that investors are paying a higher price for each $1 of company earnings. That is not a good or a bad thing per se, but a high P/E does imply buyers are optimistic about the future.
How Growth Rates Impact P/E Ratios
Companies that shrink earnings per share quickly will rapidly decrease the 'E' in the equation. That means unless the share price falls, the P/E will increase in a few years. A higher P/E should indicate the stock is expensive relative to others -- and that may encourage shareholders to sell.
Compass Minerals International's 90% EPS improvement over the last year was like bamboo growth after rain; rapid and impressive. Unfortunately, earnings per share are down 14% a year, over 5 years.
How Does Compass Minerals International's P/E Ratio Compare To Its Peers?
The P/E ratio indicates whether the market has higher or lower expectations of a company. You can see in the image below that the average P/E (9.5) for companies in the metals and mining industry is a lot lower than Compass Minerals International's P/E.
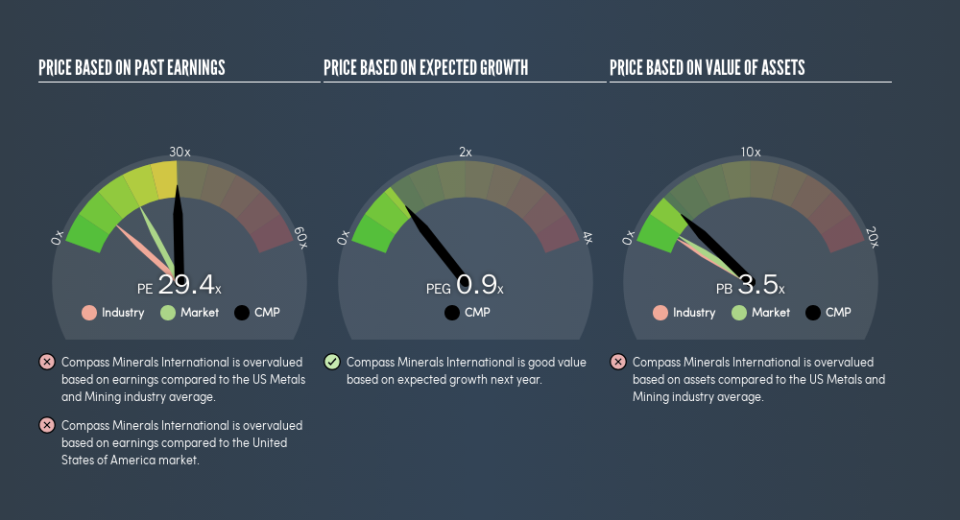
That means that the market expects Compass Minerals International will outperform other companies in its industry. The market is optimistic about the future, but that doesn't guarantee future growth. So further research is always essential. I often monitor director buying and selling.
Don't Forget: The P/E Does Not Account For Debt or Bank Deposits
It's important to note that the P/E ratio considers the market capitalization, not the enterprise value. In other words, it does not consider any debt or cash that the company may have on the balance sheet. Theoretically, a business can improve its earnings (and produce a lower P/E in the future) by investing in growth. That means taking on debt (or spending its cash).
Spending on growth might be good or bad a few years later, but the point is that the P/E ratio does not account for the option (or lack thereof).
How Does Compass Minerals International's Debt Impact Its P/E Ratio?
Compass Minerals International's net debt is 67% of its market cap. This is enough debt that you'd have to make some adjustments before using the P/E ratio to compare it to a company with net cash.
The Verdict On Compass Minerals International's P/E Ratio
Compass Minerals International trades on a P/E ratio of 30.1, which is above the US market average of 18.2. Its meaningful level of debt should warrant a lower P/E ratio, but the fast EPS growth is a positive. So it seems likely the market is overlooking the debt because of the fast earnings growth.
When the market is wrong about a stock, it gives savvy investors an opportunity. If the reality for a company is better than it expects, you can make money by buying and holding for the long term. So this free visualization of the analyst consensus on future earnings could help you make the right decision about whether to buy, sell, or hold.
You might be able to find a better buy than Compass Minerals International. If you want a selection of possible winners, check out this free list of interesting companies that trade on a P/E below 20 (but have proven they can grow earnings).
We aim to bring you long-term focused research analysis driven by fundamental data. Note that our analysis may not factor in the latest price-sensitive company announcements or qualitative material.
If you spot an error that warrants correction, please contact the editor at editorial-team@simplywallst.com. This article by Simply Wall St is general in nature. It does not constitute a recommendation to buy or sell any stock, and does not take account of your objectives, or your financial situation. Simply Wall St has no position in the stocks mentioned. Thank you for reading.
