How Does Discover Financial Services's (NYSE:DFS) P/E Compare To Its Industry, After The Share Price Drop?

Unfortunately for some shareholders, the Discover Financial Services (NYSE:DFS) share price has dived 36% in the last thirty days. Indeed the recent decline has arguably caused some bitterness for shareholders who have held through the 33% drop over twelve months.
Assuming nothing else has changed, a lower share price makes a stock more attractive to potential buyers. While the market sentiment towards a stock is very changeable, in the long run, the share price will tend to move in the same direction as earnings per share. So, on certain occasions, long term focussed investors try to take advantage of pessimistic expectations to buy shares at a better price. One way to gauge market expectations of a stock is to look at its Price to Earnings Ratio (PE Ratio). Investors have optimistic expectations of companies with higher P/E ratios, compared to companies with lower P/E ratios.
Check out our latest analysis for Discover Financial Services
How Does Discover Financial Services's P/E Ratio Compare To Its Peers?
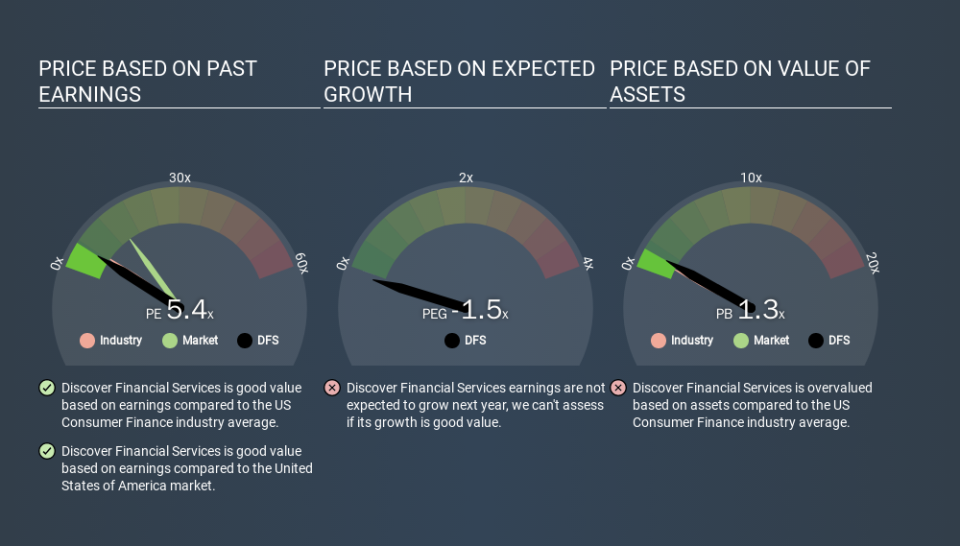
We can tell from its P/E ratio of 5.37 that sentiment around Discover Financial Services isn't particularly high. If you look at the image below, you can see Discover Financial Services has a lower P/E than the average (6.2) in the consumer finance industry classification.
Discover Financial Services's P/E tells us that market participants think it will not fare as well as its peers in the same industry. Since the market seems unimpressed with Discover Financial Services, it's quite possible it could surprise on the upside. If you consider the stock interesting, further research is recommended. For example, I often monitor director buying and selling.
How Growth Rates Impact P/E Ratios
Generally speaking the rate of earnings growth has a profound impact on a company's P/E multiple. That's because companies that grow earnings per share quickly will rapidly increase the 'E' in the equation. Therefore, even if you pay a high multiple of earnings now, that multiple will become lower in the future. Then, a lower P/E should attract more buyers, pushing the share price up.
Most would be impressed by Discover Financial Services earnings growth of 16% in the last year. And earnings per share have improved by 13% annually, over the last five years. So one might expect an above average P/E ratio.
Remember: P/E Ratios Don't Consider The Balance Sheet
It's important to note that the P/E ratio considers the market capitalization, not the enterprise value. Thus, the metric does not reflect cash or debt held by the company. Hypothetically, a company could reduce its future P/E ratio by spending its cash (or taking on debt) to achieve higher earnings.
Such spending might be good or bad, overall, but the key point here is that you need to look at debt to understand the P/E ratio in context.
So What Does Discover Financial Services's Balance Sheet Tell Us?
Net debt totals a substantial 135% of Discover Financial Services's market cap. This is a relatively high level of debt, so the stock probably deserves a relatively low P/E ratio. Keep that in mind when comparing it to other companies.
The Bottom Line On Discover Financial Services's P/E Ratio
Discover Financial Services has a P/E of 5.4. That's below the average in the US market, which is 13.3. The company has a meaningful amount of debt on the balance sheet, but that should not eclipse the solid earnings growth. If the company can continue to grow earnings, then the current P/E may be unjustifiably low. What can be absolutely certain is that the market has become more pessimistic about Discover Financial Services over the last month, with the P/E ratio falling from 8.4 back then to 5.4 today. For those who prefer invest in growth, this stock apparently offers limited promise, but the deep value investors may find the pessimism around this stock enticing.
Investors have an opportunity when market expectations about a stock are wrong. If it is underestimating a company, investors can make money by buying and holding the shares until the market corrects itself. So this free visualization of the analyst consensus on future earnings could help you make the right decision about whether to buy, sell, or hold.
You might be able to find a better buy than Discover Financial Services. If you want a selection of possible winners, check out this free list of interesting companies that trade on a P/E below 20 (but have proven they can grow earnings).
If you spot an error that warrants correction, please contact the editor at editorial-team@simplywallst.com. This article by Simply Wall St is general in nature. It does not constitute a recommendation to buy or sell any stock, and does not take account of your objectives, or your financial situation. Simply Wall St has no position in the stocks mentioned.
We aim to bring you long-term focused research analysis driven by fundamental data. Note that our analysis may not factor in the latest price-sensitive company announcements or qualitative material. Thank you for reading.
