How Does DRDGOLD Limited (NYSE:DRD) Fare As A Dividend Stock?

Could DRDGOLD Limited (NYSE:DRD) be an attractive dividend share to own for the long haul? Investors are often drawn to strong companies with the idea of reinvesting the dividends. Unfortunately, it's common for investors to be enticed in by the seemingly attractive yield, and lose money when the company has to cut its dividend payments.
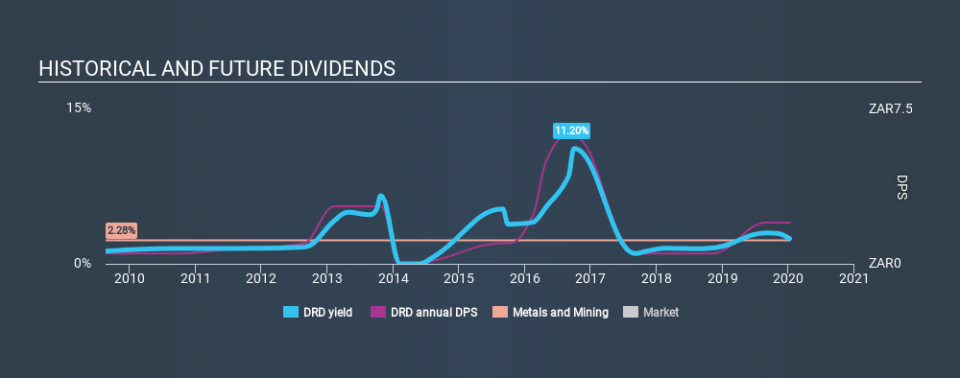
While DRDGOLD's 2.5% dividend yield is not the highest, we think its lengthy payment history is quite interesting. Some simple analysis can offer a lot of insights when buying a company for its dividend, and we'll go through this below.
Click the interactive chart for our full dividend analysis
Payout ratios
Dividends are typically paid from company earnings. If a company pays more in dividends than it earned, then the dividend might become unsustainable - hardly an ideal situation. Comparing dividend payments to a company's net profit after tax is a simple way of reality-checking whether a dividend is sustainable. DRDGOLD paid out 169% of its profit as dividends, over the trailing twelve month period. Unless there are extenuating circumstances, from the perspective of an investor who hopes to own the company for many years, a payout ratio of above 100% is definitely a concern.
While the above analysis focuses on dividends relative to a company's earnings, we do note DRDGOLD's strong net cash position, which will let it pay larger dividends for a time, should it choose.
Remember, you can always get a snapshot of DRDGOLD's latest financial position, by checking our visualisation of its financial health.
Dividend Volatility
From the perspective of an income investor who wants to earn dividends for many years, there is not much point buying a stock if its dividend is regularly cut or is not reliable. For the purpose of this article, we only scrutinise the last decade of DRDGOLD's dividend payments. Its dividend payments have fallen by 20% or more on at least one occasion over the past ten years. During the past ten-year period, the first annual payment was R0.50 in 2010, compared to R2.00 last year. This works out to be a compound annual growth rate (CAGR) of approximately 15% a year over that time. The dividends haven't grown at precisely 15% every year, but this is a useful way to average out the historical rate of growth.
It's not great to see that the payment has been cut in the past. We're generally more wary of companies that have cut their dividend before, as they tend to perform worse in an economic downturn.
Dividend Growth Potential
With a relatively unstable dividend, it's even more important to see if earnings per share (EPS) are growing. Why take the risk of a dividend getting cut, unless there's a good chance of bigger dividends in future? Over the past five years, it looks as though DRDGOLD's EPS have declined at around 4.4% a year. Declining earnings per share over a number of years is not a great sign for the dividend investor. Without some improvement, this does not bode well for the long term value of a company's dividend.
Conclusion
To summarise, shareholders should always check that DRDGOLD's dividends are affordable, that its dividend payments are relatively stable, and that it has decent prospects for growing its earnings and dividend. First, it's not great to see how much of its earnings are being paid as dividends. Second, earnings per share have been in decline, and its dividend has been cut at least once in the past. With this information in mind, we think DRDGOLD may not be an ideal dividend stock.
Are management backing themselves to deliver performance? Check their shareholdings in DRDGOLD in our latest insider ownership analysis.
If you are a dividend investor, you might also want to look at our curated list of dividend stocks yielding above 3%.
If you spot an error that warrants correction, please contact the editor at editorial-team@simplywallst.com. This article by Simply Wall St is general in nature. It does not constitute a recommendation to buy or sell any stock, and does not take account of your objectives, or your financial situation. Simply Wall St has no position in the stocks mentioned.
We aim to bring you long-term focused research analysis driven by fundamental data. Note that our analysis may not factor in the latest price-sensitive company announcements or qualitative material. Thank you for reading.

