How Does Investing In Clancy Exploration Limited (ASX:CLY) Impact Your Portfolio?

If you are a shareholder in Clancy Exploration Limited’s (ASX:CLY), or are thinking about investing in the company, knowing how it contributes to the risk and reward profile of your portfolio is important. CLY is exposed to market-wide risk, which arises from investing in the stock market. This risk reflects changes in economic and political factors that affects all stocks, and is measured by its beta. Different characteristics of a stock expose it to various levels of market risk, and the market as a whole represents a beta value of one. A stock with a beta greater than one is expected to exhibit higher volatility resulting from market-wide shocks compared to one with a beta below one.
View our latest analysis for Clancy Exploration
An interpretation of CLY’s beta
With a five-year beta of 0.46, Clancy Exploration appears to be a less volatile company compared to the rest of the market. This means the stock is more defensive against the ups and downs of a stock market, moving by less than the entire market index in times of change. Based on this beta value, CLY appears to be a stock that an investor with a high-beta portfolio would look for to reduce risk exposure to the market.
Does CLY’s size and industry impact the expected beta?
With a market cap of AU$15.62M, CLY falls within the small-cap spectrum of stocks, which are found to experience higher relative risk compared to larger companies. In addition to size, CLY also operates in the metals and mining industry, which has commonly demonstrated strong reactions to market-wide shocks. Therefore, investors may expect high beta associated with small companies, as well as those operating in the metals and mining industry, relative to those more well-established firms in a more defensive industry. This is an interesting conclusion, since both CLY’s size and industry indicates the stock should have a higher beta than it currently has. A potential driver of this variance can be a fundamental factor, which we will take a look at next.
Can CLY’s asset-composition point to a higher beta?
During times of economic downturn, low demand may cause companies to readjust production of their goods and services. It is more difficult for companies to lower their cost, if the majority of these costs are generated by fixed assets. Therefore, this is a type of risk which is associated with higher beta. I test CLY’s ratio of fixed assets to total assets in order to determine how high the risk is associated with this type of constraint. With a fixed-assets-to-total-assets ratio of greater than 30%, CLY appears to be a company that invests a large amount of capital in assets that are hard to scale down on short-notice. As a result, this aspect of CLY indicates a higher beta than a similar size company with a lower portion of fixed assets on their balance sheet. This outcome contradicts CLY’s current beta value which indicates a below-average volatility.
What this means for you:
You could benefit from lower risk during times of economic decline by holding onto CLY. Take into account your portfolio sensitivity to the market before you invest in the stock, as well as where we are in the current economic cycle. Depending on the composition of your portfolio, CLY may be a valuable stock to hold onto in order to cushion the impact of a downturn. In order to fully understand whether CLY is a good investment for you, we also need to consider important company-specific fundamentals such as Clancy Exploration’s financial health and performance track record. I highly recommend you to complete your research by taking a look at the following:
Financial Health: Is CLY’s operations financially sustainable? Balance sheets can be hard to analyze, which is why we’ve done it for you. Check out our financial health checks here.
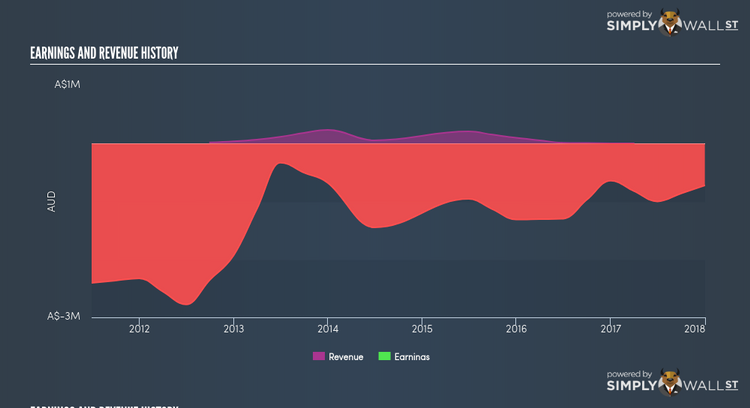
Past Track Record: Has CLY been consistently performing well irrespective of the ups and downs in the market? Go into more detail in the past performance analysis and take a look at the free visual representations of CLY’s historicals for more clarity.
Other High-Performing Stocks: Are there other stocks that provide better prospects with proven track records? Explore our free list of these great stocks here.
To help readers see pass the short term volatility of the financial market, we aim to bring you a long-term focused research analysis purely driven by fundamental data. Note that our analysis does not factor in the latest price sensitive company announcements.
The author is an independent contributor and at the time of publication had no position in the stocks mentioned.
