How Does LCI Industries's (NYSE:LCII) P/E Compare To Its Industry, After The Share Price Drop?

To the annoyance of some shareholders, LCI Industries (NYSE:LCII) shares are down a considerable 33% in the last month. Even longer term holders have taken a real hit with the stock declining 5.2% in the last year.
Assuming nothing else has changed, a lower share price makes a stock more attractive to potential buyers. While the market sentiment towards a stock is very changeable, in the long run, the share price will tend to move in the same direction as earnings per share. The implication here is that long term investors have an opportunity when expectations of a company are too low. Perhaps the simplest way to get a read on investors' expectations of a business is to look at its Price to Earnings Ratio (PE Ratio). Investors have optimistic expectations of companies with higher P/E ratios, compared to companies with lower P/E ratios.
Check out our latest analysis for LCI Industries
How Does LCI Industries's P/E Ratio Compare To Its Peers?
We can tell from its P/E ratio of 12.86 that there is some investor optimism about LCI Industries. The image below shows that LCI Industries has a higher P/E than the average (11.8) P/E for companies in the auto components industry.
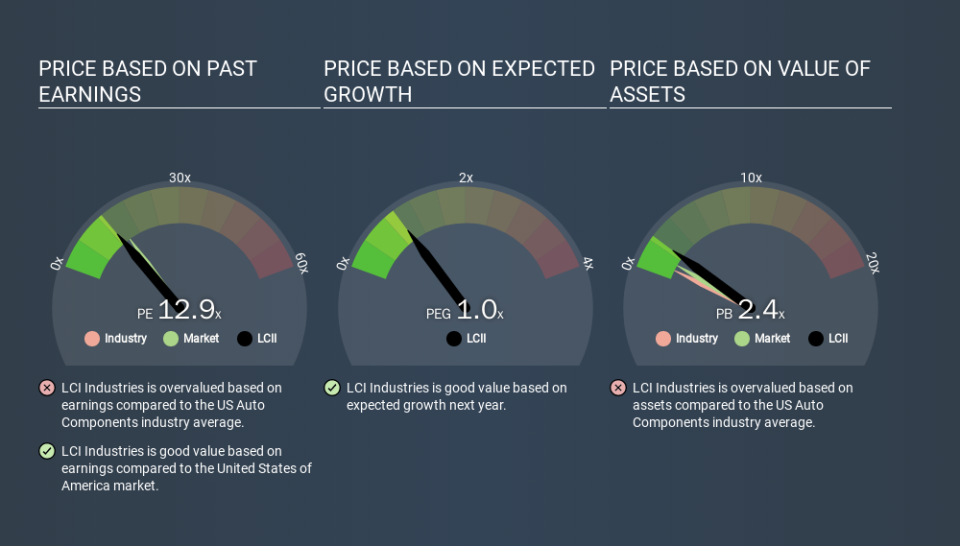
That means that the market expects LCI Industries will outperform other companies in its industry. Shareholders are clearly optimistic, but the future is always uncertain. So investors should always consider the P/E ratio alongside other factors, such as whether company directors have been buying shares.
How Growth Rates Impact P/E Ratios
P/E ratios primarily reflect market expectations around earnings growth rates. Earnings growth means that in the future the 'E' will be higher. Therefore, even if you pay a high multiple of earnings now, that multiple will become lower in the future. Then, a lower P/E should attract more buyers, pushing the share price up.
LCI Industries had pretty flat EPS growth in the last year. But over the longer term (5 years) earnings per share have increased by 18%.
A Limitation: P/E Ratios Ignore Debt and Cash In The Bank
It's important to note that the P/E ratio considers the market capitalization, not the enterprise value. In other words, it does not consider any debt or cash that the company may have on the balance sheet. Hypothetically, a company could reduce its future P/E ratio by spending its cash (or taking on debt) to achieve higher earnings.
Such expenditure might be good or bad, in the long term, but the point here is that the balance sheet is not reflected by this ratio.
Is Debt Impacting LCI Industries's P/E?
LCI Industries's net debt equates to 32% of its market capitalization. While it's worth keeping this in mind, it isn't a worry.
The Bottom Line On LCI Industries's P/E Ratio
LCI Industries trades on a P/E ratio of 12.9, which is fairly close to the US market average of 13.3. With modest debt, and a lack of recent growth, it would seem the market is expecting improvement in earnings. What can be absolutely certain is that the market has become significantly less optimistic about LCI Industries over the last month, with the P/E ratio falling from 19.3 back then to 12.9 today. For those who don't like to trade against momentum, that could be a warning sign, but a contrarian investor might want to take a closer look.
Investors should be looking to buy stocks that the market is wrong about. If the reality for a company is not as bad as the P/E ratio indicates, then the share price should increase as the market realizes this. So this free visualization of the analyst consensus on future earnings could help you make the right decision about whether to buy, sell, or hold.
Of course, you might find a fantastic investment by looking at a few good candidates. So take a peek at this free list of companies with modest (or no) debt, trading on a P/E below 20.
If you spot an error that warrants correction, please contact the editor at editorial-team@simplywallst.com. This article by Simply Wall St is general in nature. It does not constitute a recommendation to buy or sell any stock, and does not take account of your objectives, or your financial situation. Simply Wall St has no position in the stocks mentioned.
We aim to bring you long-term focused research analysis driven by fundamental data. Note that our analysis may not factor in the latest price-sensitive company announcements or qualitative material. Thank you for reading.
