Does Magnolia Petroleum Plc’s (AIM:MAGP) 54.9% Earnings Growth Make It An Outperformer?

After reading Magnolia Petroleum Plc’s (AIM:MAGP) latest earnings update (30 June 2017), I found it beneficial to look back at how the company has performed in the past and compare this against the most recent numbers. As a long-term investor I tend to pay attention to earnings trend, rather than a single number at one point in time. I also like to compare against an industry benchmark to understand whether MAGP has outperformed, or whether it is simply riding an industry wave. Below is a brief commentary on my key takeaways. View our latest analysis for Magnolia Petroleum
Were MAGP’s earnings stronger than its past performances and the industry?
I prefer to use the ‘latest twelve-month’ data, which annualizes the most recent half-year data, or in some cases, the latest annual report is already the most recent financial year data. This blend allows me to assess different stocks on a more comparable basis, using new information. For Magnolia Petroleum, the latest earnings -$5.7M, which, relative to last year’s level, has become less negative. Since these values are somewhat short-term thinking, I’ve estimated an annualized five-year value for MAGP’s net income, which stands at -$1.8M. This means Magnolia Petroleum has historically performed better than recently, while it seems like earnings are now heading back towards a more favorable position once more.
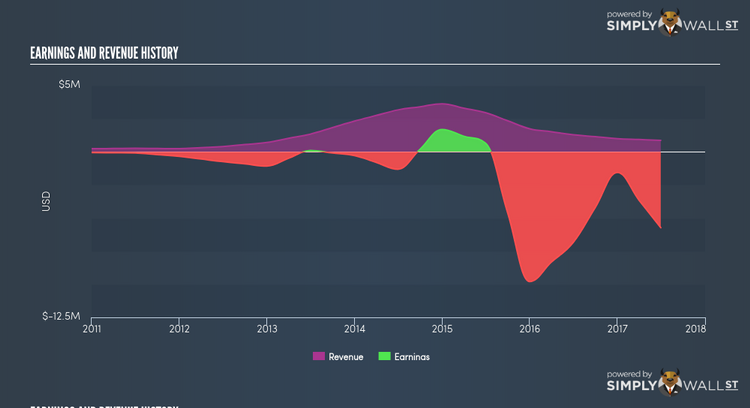
We can further analyze Magnolia Petroleum’s loss by looking at what’s going on in the industry along with within the company. First, I want to briefly look into the line items. Revenue growth over last couple of years has increased by 17.19%, indicating that Magnolia Petroleum is in a high-growth period with expenses racing ahead elevated top-line growth rates. Eyeballing growth from a sector-level, the UK oil, gas and consumable fuels industry has been multiplying average earnings growth of 61.62% over the previous twelve months, and a flatter -0.73% over the previous few years. This means that whatever uplift the industry is profiting from, Magnolia Petroleum has not been able to realize the gains unlike its average peer.
What does this mean?
While past data is useful, it doesn’t tell the whole story. With companies that are currently loss-making, it is always difficult to forecast what will occur going forward, and when. The most useful step is to assess company-specific issues Magnolia Petroleum may be facing and whether management guidance has regularly been met in the past. I suggest you continue to research Magnolia Petroleum to get a better picture of the stock by looking at:
1. Financial Health: Is MAGP’s operations financially sustainable? Balance sheets can be hard to analyze, which is why we’ve done it for you. Check out our financial health checks here.
2. Valuation: What is MAGP worth today? Is the stock undervalued, even when its growth outlook is factored into its intrinsic value? The intrinsic value infographic in our free research report helps visualize whether MAGP is currently mispriced by the market.
3. Other High-Performing Stocks: Are there other stocks that provide better prospects with proven track records? Explore our free list of these great stocks here.
NB: Figures in this article are calculated using data from the last twelve months, which refer to the 12-month period ending on the last date of the month the financial statement is dated. This may not be consistent with full year annual report figures.
To help readers see pass the short term volatility of the financial market, we aim to bring you a long-term focused research analysis purely driven by fundamental data. Note that our analysis does not factor in the latest price sensitive company announcements.
The author is an independent contributor and at the time of publication had no position in the stocks mentioned.
