Does The Market Have A Low Tolerance For DHI Group, Inc.'s (NYSE:DHX) Mixed Fundamentals?
DHI Group (NYSE:DHX) has had a rough month with its share price down 4.5%. It seems that the market might have completely ignored the positive aspects of the company's fundamentals and decided to weigh-in more on the negative aspects. Stock prices are usually driven by a company’s financial performance over the long term, and therefore we decided to pay more attention to the company's financial performance. Particularly, we will be paying attention to DHI Group's ROE today.
Return on equity or ROE is an important factor to be considered by a shareholder because it tells them how effectively their capital is being reinvested. Simply put, it is used to assess the profitability of a company in relation to its equity capital.
Check out our latest analysis for DHI Group
How Is ROE Calculated?
The formula for return on equity is:
Return on Equity = Net Profit (from continuing operations) ÷ Shareholders' Equity
So, based on the above formula, the ROE for DHI Group is:
3.3% = US$3.3m ÷ US$101m (Based on the trailing twelve months to March 2023).
The 'return' refers to a company's earnings over the last year. One way to conceptualize this is that for each $1 of shareholders' capital it has, the company made $0.03 in profit.
Why Is ROE Important For Earnings Growth?
So far, we've learned that ROE is a measure of a company's profitability. Based on how much of its profits the company chooses to reinvest or "retain", we are then able to evaluate a company's future ability to generate profits. Assuming everything else remains unchanged, the higher the ROE and profit retention, the higher the growth rate of a company compared to companies that don't necessarily bear these characteristics.
DHI Group's Earnings Growth And 3.3% ROE
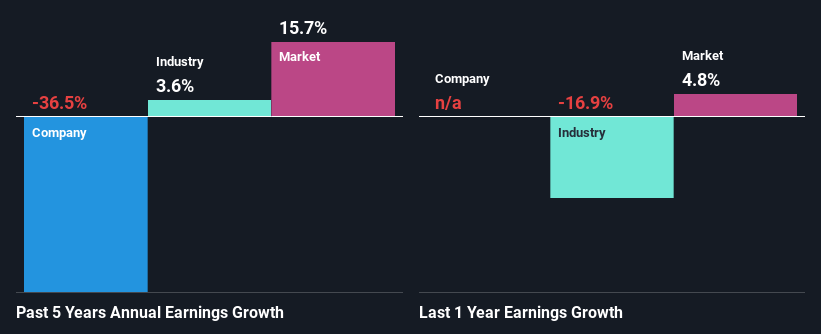
It is hard to argue that DHI Group's ROE is much good in and of itself. Not just that, even compared to the industry average of 7.8%, the company's ROE is entirely unremarkable. Therefore, it might not be wrong to say that the five year net income decline of 36% seen by DHI Group was possibly a result of it having a lower ROE. However, there could also be other factors causing the earnings to decline. For example, the business has allocated capital poorly, or that the company has a very high payout ratio.
However, when we compared DHI Group's growth with the industry we found that while the company's earnings have been shrinking, the industry has seen an earnings growth of 3.6% in the same period. This is quite worrisome.
The basis for attaching value to a company is, to a great extent, tied to its earnings growth. It’s important for an investor to know whether the market has priced in the company's expected earnings growth (or decline). By doing so, they will have an idea if the stock is headed into clear blue waters or if swampy waters await. One good indicator of expected earnings growth is the P/E ratio which determines the price the market is willing to pay for a stock based on its earnings prospects. So, you may want to check if DHI Group is trading on a high P/E or a low P/E, relative to its industry.
Is DHI Group Making Efficient Use Of Its Profits?
DHI Group doesn't pay any dividend, meaning that the company is keeping all of its profits, which makes us wonder why it is retaining its earnings if it can't use them to grow its business. So there might be other factors at play here which could potentially be hampering growth. For example, the business has faced some headwinds.
Conclusion
In total, we're a bit ambivalent about DHI Group's performance. Even though it appears to be retaining most of its profits, given the low ROE, investors may not be benefitting from all that reinvestment after all. The low earnings growth suggests our theory correct. Having said that, looking at current analyst estimates, we found that the company's earnings growth rate is expected to see a huge improvement. To know more about the company's future earnings growth forecasts take a look at this free report on analyst forecasts for the company to find out more.
Have feedback on this article? Concerned about the content? Get in touch with us directly. Alternatively, email editorial-team (at) simplywallst.com.
This article by Simply Wall St is general in nature. We provide commentary based on historical data and analyst forecasts only using an unbiased methodology and our articles are not intended to be financial advice. It does not constitute a recommendation to buy or sell any stock, and does not take account of your objectives, or your financial situation. We aim to bring you long-term focused analysis driven by fundamental data. Note that our analysis may not factor in the latest price-sensitive company announcements or qualitative material. Simply Wall St has no position in any stocks mentioned.
Join A Paid User Research Session
You’ll receive a US$30 Amazon Gift card for 1 hour of your time while helping us build better investing tools for the individual investors like yourself. Sign up here
