Does The Market Have A Low Tolerance For DHI Group, Inc.'s (NYSE:DHX) Mixed Fundamentals?
DHI Group (NYSE:DHX) has had a rough three months with its share price down 21%. It is possible that the markets have ignored the company's differing financials and decided to lean-in to the negative sentiment. Long-term fundamentals are usually what drive market outcomes, so it's worth paying close attention. Particularly, we will be paying attention to DHI Group's ROE today.
ROE or return on equity is a useful tool to assess how effectively a company can generate returns on the investment it received from its shareholders. In simpler terms, it measures the profitability of a company in relation to shareholder's equity.
See our latest analysis for DHI Group
How To Calculate Return On Equity?
ROE can be calculated by using the formula:
Return on Equity = Net Profit (from continuing operations) ÷ Shareholders' Equity
So, based on the above formula, the ROE for DHI Group is:
3.6% = US$3.7m ÷ US$103m (Based on the trailing twelve months to September 2023).
The 'return' is the amount earned after tax over the last twelve months. Another way to think of that is that for every $1 worth of equity, the company was able to earn $0.04 in profit.
What Has ROE Got To Do With Earnings Growth?
We have already established that ROE serves as an efficient profit-generating gauge for a company's future earnings. Based on how much of its profits the company chooses to reinvest or "retain", we are then able to evaluate a company's future ability to generate profits. Assuming everything else remains unchanged, the higher the ROE and profit retention, the higher the growth rate of a company compared to companies that don't necessarily bear these characteristics.
DHI Group's Earnings Growth And 3.6% ROE
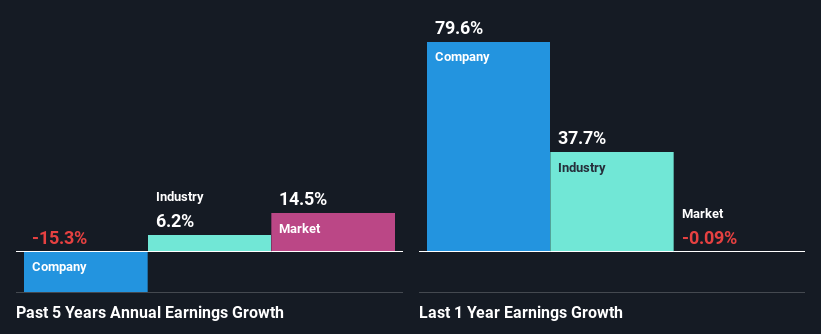
It is hard to argue that DHI Group's ROE is much good in and of itself. Not just that, even compared to the industry average of 11%, the company's ROE is entirely unremarkable. Therefore, it might not be wrong to say that the five year net income decline of 15% seen by DHI Group was possibly a result of it having a lower ROE. However, there could also be other factors causing the earnings to decline. For example, the business has allocated capital poorly, or that the company has a very high payout ratio.
So, as a next step, we compared DHI Group's performance against the industry and were disappointed to discover that while the company has been shrinking its earnings, the industry has been growing its earnings at a rate of 6.2% over the last few years.
Earnings growth is an important metric to consider when valuing a stock. It’s important for an investor to know whether the market has priced in the company's expected earnings growth (or decline). By doing so, they will have an idea if the stock is headed into clear blue waters or if swampy waters await. Is DHI Group fairly valued compared to other companies? These 3 valuation measures might help you decide.
Is DHI Group Efficiently Re-investing Its Profits?
DHI Group doesn't pay any dividend, meaning that potentially all of its profits are being reinvested in the business, which doesn't explain why the company's earnings have shrunk if it is retaining all of its profits. So there could be some other explanations in that regard. For instance, the company's business may be deteriorating.
Conclusion
Overall, we have mixed feelings about DHI Group. While the company does have a high rate of profit retention, its low rate of return is probably hampering its earnings growth. That being so, the latest industry analyst forecasts show that the analysts are expecting to see a huge improvement in the company's earnings growth rate. To know more about the latest analysts predictions for the company, check out this visualization of analyst forecasts for the company.
Have feedback on this article? Concerned about the content? Get in touch with us directly. Alternatively, email editorial-team (at) simplywallst.com.
This article by Simply Wall St is general in nature. We provide commentary based on historical data and analyst forecasts only using an unbiased methodology and our articles are not intended to be financial advice. It does not constitute a recommendation to buy or sell any stock, and does not take account of your objectives, or your financial situation. We aim to bring you long-term focused analysis driven by fundamental data. Note that our analysis may not factor in the latest price-sensitive company announcements or qualitative material. Simply Wall St has no position in any stocks mentioned.
