Does MetLife Inc’s (NYSE:MET) Past Performance Indicate A Stronger Future?

After reading MetLife Inc’s (NYSE:MET) most recent earnings announcement (31 December 2017), I found it useful to look back at how the company has performed in the past and compare this against the latest numbers. As a long term investor, I pay close attention to earnings trend, rather than the figures published at one point in time. I also compare against an industry benchmark to check whether MetLife’s performance has been impacted by industry movements. In this article I briefly touch on my key findings. See our latest analysis for MetLife
Commentary On MET’s Past Performance
For the purpose of this commentary, I like to use the ‘latest twelve-month’ data, which annualizes the latest 6-month earnings release, or some times, the latest annual report is already the most recent financial data. This blend allows me to analyze many different companies on a similar basis, using the latest information. For MetLife, its most recent bottom-line (trailing twelve month) is US$4.89B, which, in comparison to the previous year’s level, has climbed up by 40.56%. Given that these values may be fairly short-term, I’ve created an annualized five-year figure for MET’s net income, which stands at US$3.75B This suggests that, on average, MetLife has been able to steadily raise its profits over the last few years as well.
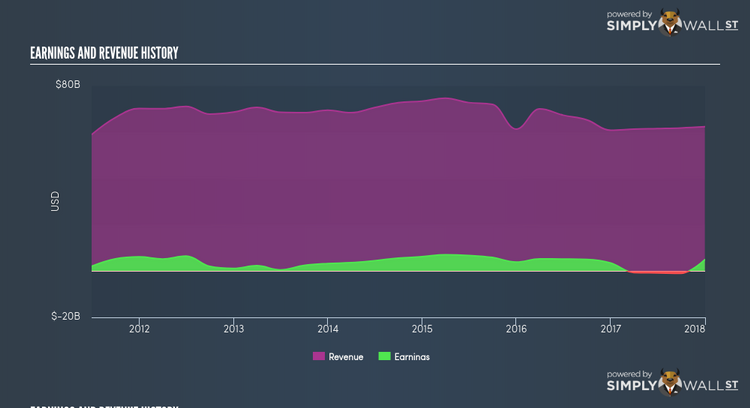
How has it been able to do this? Well, let’s take a look at whether it is solely attributable to industry tailwinds, or if MetLife has seen some company-specific growth. Although both top-line and bottom-line growth rates in the past few years, were, on average, negative, earnings were more so. While this has led to a margin contraction, it has cushioned MetLife’s earnings contraction. Looking at growth from a sector-level, the US insurance industry has been growing, albeit, at a muted single-digit rate of 9.92% over the past twelve months, and 8.54% over the past five. This shows that whatever tailwind the industry is profiting from, MetLife is capable of leveraging this to its advantage.
What does this mean?
MetLife’s track record can be a valuable insight into its earnings performance, but it certainly doesn’t tell the whole story. Companies that have performed well in the past, such as MetLife gives investors conviction. However, the next step would be to assess whether the future looks as optimistic. I recommend you continue to research MetLife to get a better picture of the stock by looking at:
Future Outlook: What are well-informed industry analysts predicting for MET’s future growth? Take a look at our free research report of analyst consensus for MET’s outlook.
Financial Health: Is MET’s operations financially sustainable? Balance sheets can be hard to analyze, which is why we’ve done it for you. Check out our financial health checks here.
Other High-Performing Stocks: Are there other stocks that provide better prospects with proven track records? Explore our free list of these great stocks here.
NB: Figures in this article are calculated using data from the trailing twelve months from 31 December 2017. This may not be consistent with full year annual report figures.
To help readers see pass the short term volatility of the financial market, we aim to bring you a long-term focused research analysis purely driven by fundamental data. Note that our analysis does not factor in the latest price sensitive company announcements.
The author is an independent contributor and at the time of publication had no position in the stocks mentioned.
