Does Mid-Southern Bancorp, Inc. (NASDAQ:MSVB) Have A Good P/E Ratio?

Mid-Southern Bancorp (NASDAQ:MSVB) shares have given back plenty of recent gains in the last month, dropping . Indeed, the recent drop has reduced the annual gain to a relatively sedate 6.5% over the last twelve months.
All else being equal, a sharp share price increase should make a stock less attractive to potential investors. In the long term, share prices tend to follow earnings per share, but in the short term prices bounce around in response to short term factors (which are not always obvious). The implication here is that deep value investors might steer clear when expectations of a company are too high. Perhaps the simplest way to get a read on investors' expectations of a business is to look at its Price to Earnings Ratio (PE Ratio). A high P/E implies that investors have high expectations of what a company can achieve compared to a company with a low P/E ratio.
See our latest analysis for Mid-Southern Bancorp
How Does Mid-Southern Bancorp's P/E Ratio Compare To Its Peers?
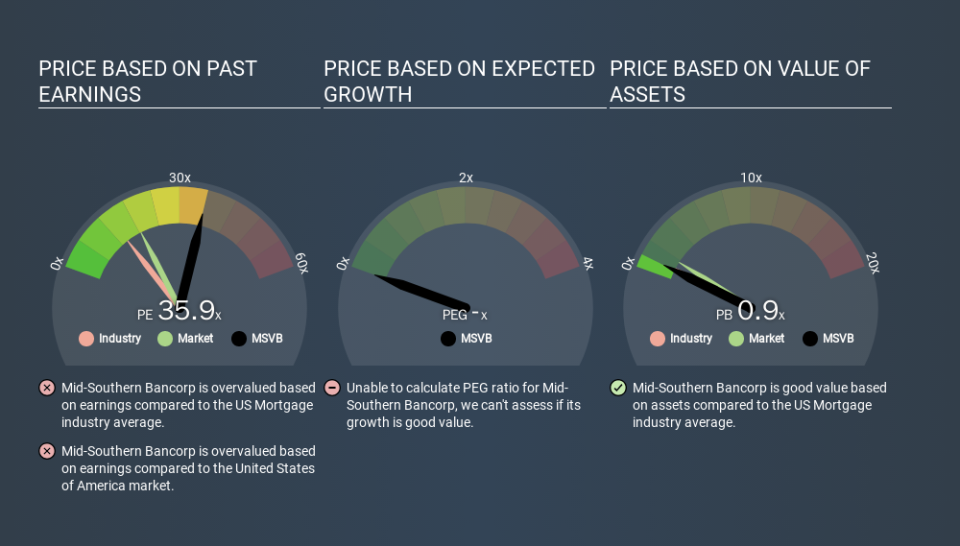
Mid-Southern Bancorp's P/E of 35.90 indicates some degree of optimism towards the stock. The image below shows that Mid-Southern Bancorp has a higher P/E than the average (13.9) P/E for companies in the mortgage industry.
Its relatively high P/E ratio indicates that Mid-Southern Bancorp shareholders think it will perform better than other companies in its industry classification. Shareholders are clearly optimistic, but the future is always uncertain. So further research is always essential. I often monitor director buying and selling.
How Growth Rates Impact P/E Ratios
Probably the most important factor in determining what P/E a company trades on is the earnings growth. That's because companies that grow earnings per share quickly will rapidly increase the 'E' in the equation. That means even if the current P/E is high, it will reduce over time if the share price stays flat. So while a stock may look expensive based on past earnings, it could be cheap based on future earnings.
It's great to see that Mid-Southern Bancorp grew EPS by 20% in the last year. And it has bolstered its earnings per share by 59% per year over the last five years. With that performance, you might expect an above average P/E ratio.
Remember: P/E Ratios Don't Consider The Balance Sheet
It's important to note that the P/E ratio considers the market capitalization, not the enterprise value. So it won't reflect the advantage of cash, or disadvantage of debt. Theoretically, a business can improve its earnings (and produce a lower P/E in the future) by investing in growth. That means taking on debt (or spending its cash).
While growth expenditure doesn't always pay off, the point is that it is a good option to have; but one that the P/E ratio ignores.
Mid-Southern Bancorp's Balance Sheet
Mid-Southern Bancorp has net cash of US$9.9m. This is fairly high at 22% of its market capitalization. That might mean balance sheet strength is important to the business, but should also help push the P/E a bit higher than it would otherwise be.
The Bottom Line On Mid-Southern Bancorp's P/E Ratio
Mid-Southern Bancorp's P/E is 35.9 which is above average (18.4) in its market. Its net cash position supports a higher P/E ratio, as does its solid recent earnings growth. Therefore it seems reasonable that the market would have relatively high expectations of the company Given Mid-Southern Bancorp's P/E ratio has declined from 35.9 to 35.9 in the last month, we know for sure that the market is less confident about the business today, than it was back then. For those who don't like to trade against momentum, that could be a warning sign, but a contrarian investor might want to take a closer look.
When the market is wrong about a stock, it gives savvy investors an opportunity. If the reality for a company is better than it expects, you can make money by buying and holding for the long term. We don't have analyst forecasts, but you might want to assess this data-rich visualization of earnings, revenue and cash flow.
Of course, you might find a fantastic investment by looking at a few good candidates. So take a peek at this free list of companies with modest (or no) debt, trading on a P/E below 20.
If you spot an error that warrants correction, please contact the editor at editorial-team@simplywallst.com. This article by Simply Wall St is general in nature. It does not constitute a recommendation to buy or sell any stock, and does not take account of your objectives, or your financial situation. Simply Wall St has no position in the stocks mentioned.
We aim to bring you long-term focused research analysis driven by fundamental data. Note that our analysis may not factor in the latest price-sensitive company announcements or qualitative material. Thank you for reading.
