What Does Moury Construct SA’s (EBR:MOUR) 11% ROCE Say About The Business?

Today we are going to look at Moury Construct SA (EBR:MOUR) to see whether it might be an attractive investment prospect. Specifically, we'll consider its Return On Capital Employed (ROCE), since that will give us an insight into how efficiently the business can generate profits from the capital it requires.
Firstly, we'll go over how we calculate ROCE. Then we'll compare its ROCE to similar companies. Then we'll determine how its current liabilities are affecting its ROCE.
Return On Capital Employed (ROCE): What is it?
ROCE measures the amount of pre-tax profits a company can generate from the capital employed in its business. In general, businesses with a higher ROCE are usually better quality. Ultimately, it is a useful but imperfect metric. Author Edwin Whiting says to be careful when comparing the ROCE of different businesses, since 'No two businesses are exactly alike.
So, How Do We Calculate ROCE?
Analysts use this formula to calculate return on capital employed:
Return on Capital Employed = Earnings Before Interest and Tax (EBIT) ÷ (Total Assets - Current Liabilities)
Or for Moury Construct:
0.11 = €6.8m ÷ (€109m - €49m) (Based on the trailing twelve months to June 2019.)
Therefore, Moury Construct has an ROCE of 11%.
See our latest analysis for Moury Construct
Does Moury Construct Have A Good ROCE?
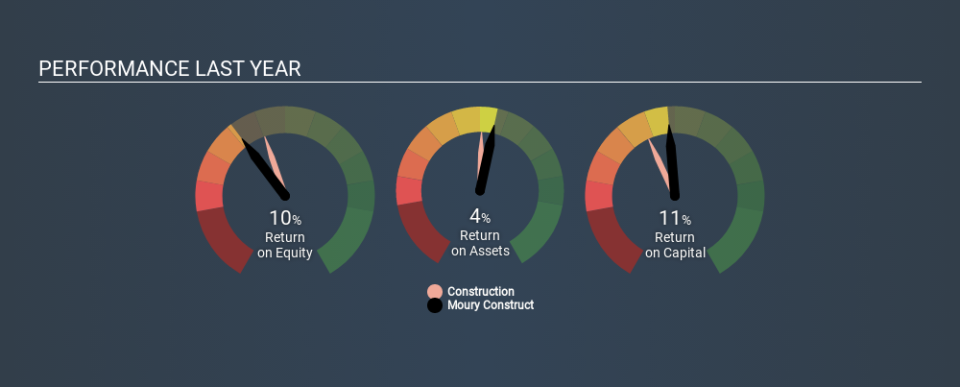
ROCE is commonly used for comparing the performance of similar businesses. It appears that Moury Construct's ROCE is fairly close to the Construction industry average of 10%. Independently of how Moury Construct compares to its industry, its ROCE in absolute terms appears decent, and the company may be worthy of closer investigation.
In our analysis, Moury Construct's ROCE appears to be 11%, compared to 3 years ago, when its ROCE was 9.0%. This makes us think the business might be improving. You can see in the image below how Moury Construct's ROCE compares to its industry. Click to see more on past growth.
It is important to remember that ROCE shows past performance, and is not necessarily predictive. Companies in cyclical industries can be difficult to understand using ROCE, as returns typically look high during boom times, and low during busts. ROCE is, after all, simply a snap shot of a single year. If Moury Construct is cyclical, it could make sense to check out this free graph of past earnings, revenue and cash flow.
How Moury Construct's Current Liabilities Impact Its ROCE
Short term (or current) liabilities, are things like supplier invoices, overdrafts, or tax bills that need to be paid within 12 months. The ROCE equation subtracts current liabilities from capital employed, so a company with a lot of current liabilities appears to have less capital employed, and a higher ROCE than otherwise. To counter this, investors can check if a company has high current liabilities relative to total assets.
Moury Construct has total liabilities of €49m and total assets of €109m. Therefore its current liabilities are equivalent to approximately 45% of its total assets. Moury Construct has a middling amount of current liabilities, increasing its ROCE somewhat.
Our Take On Moury Construct's ROCE
With a decent ROCE, the company could be interesting, but remember that the level of current liabilities make the ROCE look better. There might be better investments than Moury Construct out there, but you will have to work hard to find them . These promising businesses with rapidly growing earnings might be right up your alley.
I will like Moury Construct better if I see some big insider buys. While we wait, check out this free list of growing companies with considerable, recent, insider buying.
If you spot an error that warrants correction, please contact the editor at editorial-team@simplywallst.com. This article by Simply Wall St is general in nature. It does not constitute a recommendation to buy or sell any stock, and does not take account of your objectives, or your financial situation. Simply Wall St has no position in the stocks mentioned.
We aim to bring you long-term focused research analysis driven by fundamental data. Note that our analysis may not factor in the latest price-sensitive company announcements or qualitative material. Thank you for reading.
