Does NAHL Group plc’s (AIM:NAH) -13.1% EPS Decline Reflect A Long-Term Trend?

When NAHL Group plc (AIM:NAH) announced its most recent earnings (30 June 2017), I compared it against two factor: its historical earnings track record, and the performance of its industry peers on average. Being able to interpret how well NAHL Group has done so far requires weighing its performance against a benchmark, rather than looking at a standalone number at a point in time. In this article, I’ve summarized the key takeaways on how I see NAH has performed. See our latest analysis for NAH
Was NAH’s recent earnings decline worse than the long-term trend and the industry?
I prefer to use the ‘latest twelve-month’ data, which annualizes the latest 6-month earnings release, or some times, the latest annual report is already the most recent financial data. This allows me to examine various companies in a uniform manner using new information. NAHL Group’s most recent earnings is £10.4M, which, against the previous year’s figure, has dropped by -10.64%. Given that these figures may be somewhat short-term thinking, I have computed an annualized five-year value for NAHL Group’s net income, which stands at £10.2M. This means that although earnings declined against last year, over the past couple of years, NAHL Group’s profits have been growing on average.
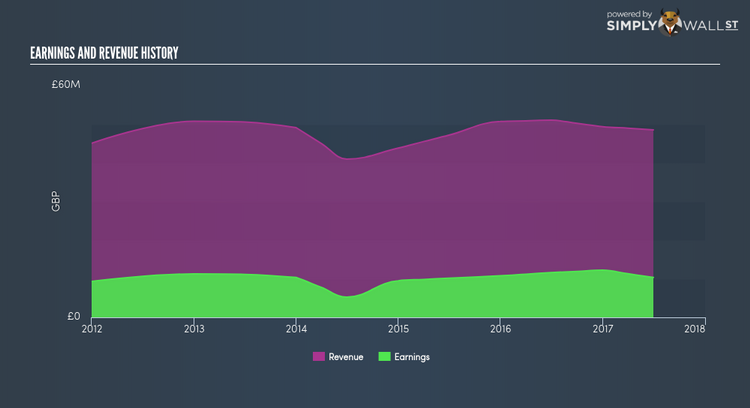
What’s enabled this growth? Let’s take a look at if it is only a result of industry tailwinds, or if NAHL Group has seen some company-specific growth. In the last few years, NAHL Group grew its bottom line faster than revenue by efficiently controlling its costs. This has led to a margin expansion and profitability over time. Viewing growth from a sector-level, the UK media industry has been enduring some headwinds over the past twelve months, leading to an average earnings drop of -6.09%. This is a major change, given that the industry has been delivering a positive rate of 9.14%, on average, over the previous few years. This suggests that any near-term headwind the industry is enduring, it’s hitting NAHL Group harder than its peers.
What does this mean?
Though NAHL Group’s past data is helpful, it is only one aspect of my investment thesis. Companies are profitable, but have unpredictable earnings, can have many factors influencing its business. You should continue to research NAHL Group to get a better picture of the stock by looking at:
1. Future Outlook: What are well-informed industry analysts predicting for NAH’s future growth? Take a look at our free research report of analyst consensus for NAH’s outlook.
2. Financial Health: Is NAH’s operations financially sustainable? Balance sheets can be hard to analyze, which is why we’ve done it for you. Check out our financial health checks here.
3. Other High-Performing Stocks: Are there other stocks that provide better prospects with proven track records? Explore our free list of these great stocks here.
NB: Figures in this article are calculated using data from the last twelve months, which refer to the 12-month period ending on the last date of the month the financial statement is dated. This may not be consistent with full year annual report figures.
To help readers see pass the short term volatility of the financial market, we aim to bring you a long-term focused research analysis purely driven by fundamental data. Note that our analysis does not factor in the latest price sensitive company announcements.
The author is an independent contributor and at the time of publication had no position in the stocks mentioned.
