Does NewOcean Energy Holdings Limited’s (HKG:342) ROCE Reflect Well On The Business?

Want to participate in a short research study? Help shape the future of investing tools and you could win a $250 gift card!
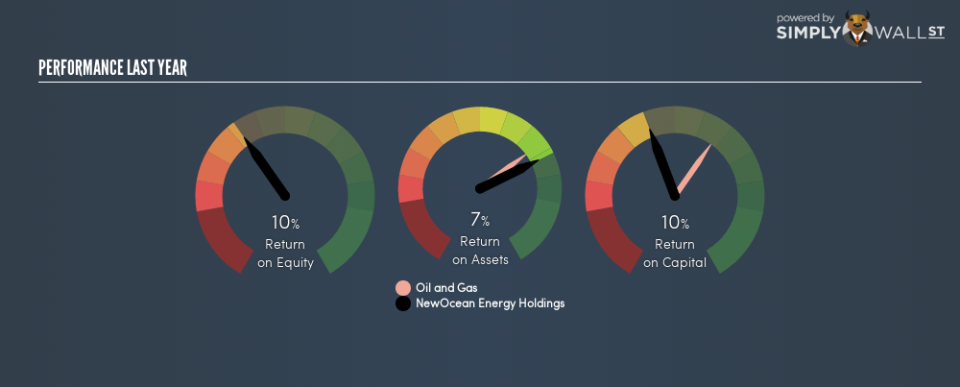
Today we’ll look at NewOcean Energy Holdings Limited (HKG:342) and reflect on its potential as an investment. To be precise, we’ll consider its Return On Capital Employed (ROCE), as that will inform our view of the quality of the business.
First, we’ll go over how we calculate ROCE. Next, we’ll compare it to others in its industry. Finally, we’ll look at how its current liabilities affect its ROCE.
Understanding Return On Capital Employed (ROCE)
ROCE is a measure of a company’s yearly pre-tax profit (its return), relative to the capital employed in the business. All else being equal, a better business will have a higher ROCE. Ultimately, it is a useful but imperfect metric. Renowned investment researcher Michael Mauboussin has suggested that a high ROCE can indicate that ‘one dollar invested in the company generates value of more than one dollar’.
How Do You Calculate Return On Capital Employed?
Analysts use this formula to calculate return on capital employed:
Return on Capital Employed = Earnings Before Interest and Tax (EBIT) ÷ (Total Assets – Current Liabilities)
Or for NewOcean Energy Holdings:
0.095 = HK$769m ÷ (HK$14b – HK$5.6b) (Based on the trailing twelve months to June 2018.)
So, NewOcean Energy Holdings has an ROCE of 9.5%.
View our latest analysis for NewOcean Energy Holdings
Does NewOcean Energy Holdings Have A Good ROCE?
When making comparisons between similar businesses, investors may find ROCE useful. Using our data, NewOcean Energy Holdings’s ROCE appears to be around the 9.9% average of the Oil and Gas industry. Aside from the industry comparison, NewOcean Energy Holdings’s ROCE is mediocre in absolute terms, considering the risk of investing in stocks versus the safety of a bank account. Readers may find more attractive investment prospects elsewhere.
NewOcean Energy Holdings’s current ROCE of 9.5% is lower than its ROCE in the past, which was 16%, 3 years ago. Therefore we wonder if the company is facing new headwinds.
Remember that this metric is backwards looking – it shows what has happened in the past, and does not accurately predict the future. ROCE can be misleading for companies in cyclical industries, with returns looking impressive during the boom times, but very weak during the busts. ROCE is, after all, simply a snap shot of a single year. We note NewOcean Energy Holdings could be considered a cyclical business. If NewOcean Energy Holdings is cyclical, it could make sense to check out this free graph of past earnings, revenue and cash flow.
How NewOcean Energy Holdings’s Current Liabilities Impact Its ROCE
Short term (or current) liabilities, are things like supplier invoices, overdrafts, or tax bills that need to be paid within 12 months. Due to the way the ROCE equation works, having large bills due in the near term can make it look as though a company has less capital employed, and thus a higher ROCE than usual. To check the impact of this, we calculate if a company has high current liabilities relative to its total assets.
NewOcean Energy Holdings has total assets of HK$14b and current liabilities of HK$5.6b. As a result, its current liabilities are equal to approximately 39% of its total assets. NewOcean Energy Holdings’s middling level of current liabilities have the effect of boosting its ROCE a bit.
The Bottom Line On NewOcean Energy Holdings’s ROCE
Despite this, its ROCE is still mediocre, and you may find more appealing investments elsewhere. You might be able to find a better buy than NewOcean Energy Holdings. If you want a selection of possible winners, check out this free list of interesting companies that trade on a P/E below 20 (but have proven they can grow earnings).
For those who like to find winning investments this free list of growing companies with recent insider purchasing, could be just the ticket.
To help readers see past the short term volatility of the financial market, we aim to bring you a long-term focused research analysis purely driven by fundamental data. Note that our analysis does not factor in the latest price-sensitive company announcements.
The author is an independent contributor and at the time of publication had no position in the stocks mentioned. For errors that warrant correction please contact the editor at editorial-team@simplywallst.com.
