How Does Ossen Innovation's (NASDAQ:OSN) P/E Compare To Its Industry, After Its Big Share Price Gain?

Ossen Innovation (NASDAQ:OSN) shares have continued recent momentum with a 32% gain in the last month alone. That's tops off a massive gain of 157% in the last year.
All else being equal, a sharp share price increase should make a stock less attractive to potential investors. In the long term, share prices tend to follow earnings per share, but in the short term prices bounce around in response to short term factors (which are not always obvious). The implication here is that deep value investors might steer clear when expectations of a company are too high. One way to gauge market expectations of a stock is to look at its Price to Earnings Ratio (PE Ratio). A high P/E implies that investors have high expectations of what a company can achieve compared to a company with a low P/E ratio.
Check out our latest analysis for Ossen Innovation
How Does Ossen Innovation's P/E Ratio Compare To Its Peers?
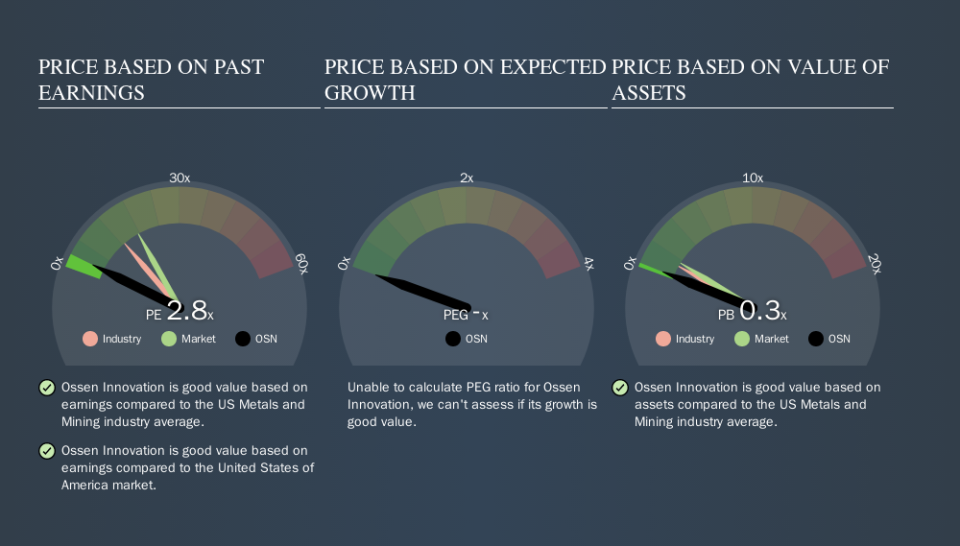
Ossen Innovation's P/E of 2.78 indicates relatively low sentiment towards the stock. If you look at the image below, you can see Ossen Innovation has a lower P/E than the average (12.4) in the metals and mining industry classification.
Its relatively low P/E ratio indicates that Ossen Innovation shareholders think it will struggle to do as well as other companies in its industry classification. While current expectations are low, the stock could be undervalued if the situation is better than the market assumes. If you consider the stock interesting, further research is recommended. For example, I often monitor director buying and selling.
How Growth Rates Impact P/E Ratios
Generally speaking the rate of earnings growth has a profound impact on a company's P/E multiple. When earnings grow, the 'E' increases, over time. Therefore, even if you pay a high multiple of earnings now, that multiple will become lower in the future. Then, a lower P/E should attract more buyers, pushing the share price up.
It's nice to see that Ossen Innovation grew EPS by a stonking 27% in the last year. And its annual EPS growth rate over 5 years is 19%. I'd therefore be a little surprised if its P/E ratio was not relatively high.
Remember: P/E Ratios Don't Consider The Balance Sheet
Don't forget that the P/E ratio considers market capitalization. So it won't reflect the advantage of cash, or disadvantage of debt. Hypothetically, a company could reduce its future P/E ratio by spending its cash (or taking on debt) to achieve higher earnings.
Such spending might be good or bad, overall, but the key point here is that you need to look at debt to understand the P/E ratio in context.
Is Debt Impacting Ossen Innovation's P/E?
Ossen Innovation has net debt worth a very significant 130% of its market capitalization. If you want to compare its P/E ratio to other companies, you must keep in mind that these debt levels would usually warrant a relatively low P/E.
The Verdict On Ossen Innovation's P/E Ratio
Ossen Innovation's P/E is 2.8 which is below average (17.2) in the US market. The company may have significant debt, but EPS growth was good last year. The low P/E ratio suggests current market expectations are muted, implying these levels of growth will not continue. What we know for sure is that investors are becoming less uncomfortable about Ossen Innovation's prospects, since they have pushed its P/E ratio from 2.1 to 2.8 over the last month. For those who like to invest in turnarounds, that might mean it's time to put the stock on a watchlist, or research it. But others might consider the opportunity to have passed.
Investors have an opportunity when market expectations about a stock are wrong. As value investor Benjamin Graham famously said, 'In the short run, the market is a voting machine but in the long run, it is a weighing machine. Although we don't have analyst forecasts you could get a better understanding of its growth by checking out this more detailed historical graph of earnings, revenue and cash flow.
You might be able to find a better buy than Ossen Innovation. If you want a selection of possible winners, check out this free list of interesting companies that trade on a P/E below 20 (but have proven they can grow earnings).
We aim to bring you long-term focused research analysis driven by fundamental data. Note that our analysis may not factor in the latest price-sensitive company announcements or qualitative material.
If you spot an error that warrants correction, please contact the editor at editorial-team@simplywallst.com. This article by Simply Wall St is general in nature. It does not constitute a recommendation to buy or sell any stock, and does not take account of your objectives, or your financial situation. Simply Wall St has no position in the stocks mentioned. Thank you for reading.
