Does Rocky Brands, Inc. (NASDAQ:RCKY) Have A Good P/E Ratio?

Want to participate in a short research study? Help shape the future of investing tools and you could win a $250 gift card!
This article is for investors who would like to improve their understanding of price to earnings ratios (P/E ratios). We’ll look at Rocky Brands, Inc.’s (NASDAQ:RCKY) P/E ratio and reflect on what it tells us about the company’s share price. Rocky Brands has a P/E ratio of 12.58, based on the last twelve months. That means that at current prices, buyers pay $12.58 for every $1 in trailing yearly profits.
Check out our latest analysis for Rocky Brands
How Do You Calculate A P/E Ratio?
The formula for P/E is:
Price to Earnings Ratio = Share Price ÷ Earnings per Share (EPS)
Or for Rocky Brands:
P/E of 12.58 = $26.05 ÷ $2.07 (Based on the year to September 2018.)
Is A High Price-to-Earnings Ratio Good?
A higher P/E ratio means that investors are paying a higher price for each $1 of company earnings. All else being equal, it’s better to pay a low price — but as Warren Buffett said, ‘It’s far better to buy a wonderful company at a fair price than a fair company at a wonderful price.’
How Growth Rates Impact P/E Ratios
Probably the most important factor in determining what P/E a company trades on is the earnings growth. That’s because companies that grow earnings per share quickly will rapidly increase the ‘E’ in the equation. Therefore, even if you pay a high multiple of earnings now, that multiple will become lower in the future. So while a stock may look expensive based on past earnings, it could be cheap based on future earnings.
Rocky Brands increased earnings per share by a whopping 238% last year. And its annual EPS growth rate over 5 years is 1.3%. So we’d generally expect it to have a relatively high P/E ratio.
How Does Rocky Brands’s P/E Ratio Compare To Its Peers?
The P/E ratio essentially measures market expectations of a company. If you look at the image below, you can see Rocky Brands has a lower P/E than the average (16.9) in the luxury industry classification.
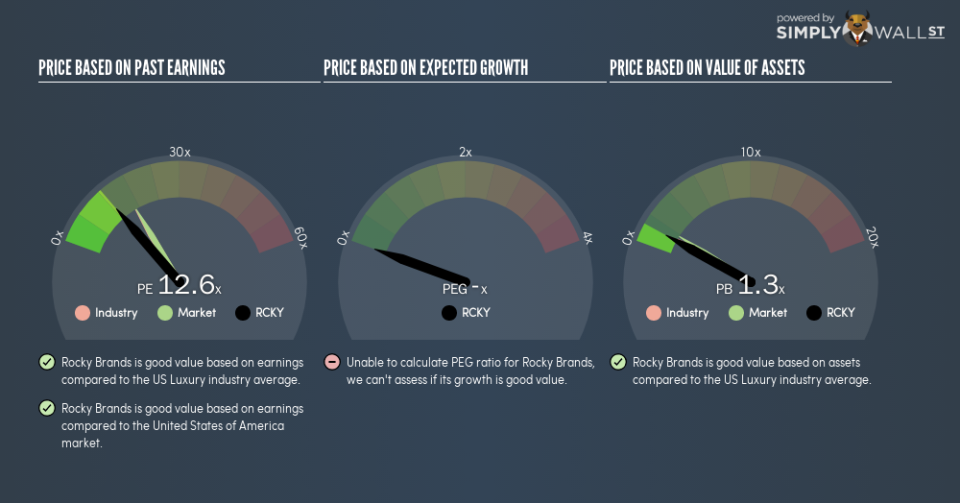
Its relatively low P/E ratio indicates that Rocky Brands shareholders think it will struggle to do as well as other companies in its industry classification. Since the market seems unimpressed with Rocky Brands, it’s quite possible it could surprise on the upside. It is arguably worth checking if insiders are buying shares, because that might imply they believe the stock is undervalued.
Don’t Forget: The P/E Does Not Account For Debt or Bank Deposits
It’s important to note that the P/E ratio considers the market capitalization, not the enterprise value. That means it doesn’t take debt or cash into account. Hypothetically, a company could reduce its future P/E ratio by spending its cash (or taking on debt) to achieve higher earnings.
Such spending might be good or bad, overall, but the key point here is that you need to look at debt to understand the P/E ratio in context.
Is Debt Impacting Rocky Brands’s P/E?
Rocky Brands has net cash of US$4.2m. That should lead to a higher P/E than if it did have debt, because its strong balance sheets gives it more options.
The Verdict On Rocky Brands’s P/E Ratio
Rocky Brands’s P/E is 12.6 which is below average (16.8) in the US market. It grew its EPS nicely over the last year, and the healthy balance sheet implies there is more potential for growth. The relatively low P/E ratio implies the market is pessimistic.
When the market is wrong about a stock, it gives savvy investors an opportunity. If the reality for a company is not as bad as the P/E ratio indicates, then the share price should increase as the market realizes this. So this free visualization of the analyst consensus on future earnings could help you make the right decision about whether to buy, sell, or hold.
Of course you might be able to find a better stock than Rocky Brands. So you may wish to see this free collection of other companies that have grown earnings strongly.
To help readers see past the short term volatility of the financial market, we aim to bring you a long-term focused research analysis purely driven by fundamental data. Note that our analysis does not factor in the latest price-sensitive company announcements.
The author is an independent contributor and at the time of publication had no position in the stocks mentioned. For errors that warrant correction please contact the editor at editorial-team@simplywallst.com.
