Does Royal Caribbean Cruises Ltd’s (NYSE:RCL) PE Ratio Signal A Buying Opportunity?

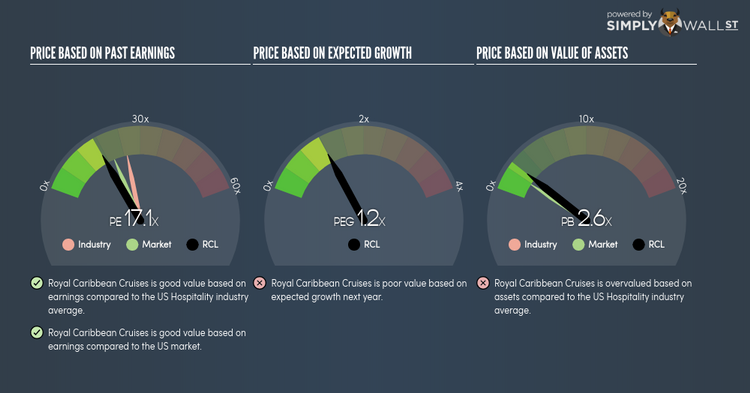
Royal Caribbean Cruises Ltd (NYSE:RCL) is currently trading at a trailing P/E of 17.1x, which is lower than the industry average of 25.1x. While RCL might seem like an attractive stock to buy, it is important to understand the assumptions behind the P/E ratio before you make any investment decisions. Today, I will break down what the P/E ratio is, how to interpret it and what to watch out for. Check out our latest analysis for Royal Caribbean Cruises
Breaking down the P/E ratio
A common ratio used for relative valuation is the P/E ratio. By comparing a stock’s price per share to its earnings per share, we are able to see how much investors are paying for each dollar of the company’s earnings.
P/E Calculation for RCL
Price-Earnings Ratio = Price per share ÷ Earnings per share
RCL Price-Earnings Ratio = $127.22 ÷ $7.44 = 17.1x
The P/E ratio isn’t a metric you view in isolation and only becomes useful when you compare it against other similar companies. We want to compare the stock’s P/E ratio to the average of companies that have similar characteristics as RCL, such as size and country of operation. A common peer group is companies that exist in the same industry, which is what I use. Since RCL’s P/E of 17.1x is lower than its industry peers (25.1x), it means that investors are paying less than they should for each dollar of RCL’s earnings. Therefore, according to this analysis, RCL is an under-priced stock.
Assumptions to be aware of
However, before you rush out to buy RCL, it is important to note that this conclusion is based on two key assumptions. Firstly, our peer group contains companies that are similar to RCL. If this isn’t the case, the difference in P/E could be due to other factors. For example, if you compared higher growth firms with RCL, then its P/E would naturally be lower since investors would reward its peers’ higher growth with a higher price. The second assumption that must hold true is that the stocks we are comparing RCL to are fairly valued by the market. If this does not hold, there is a possibility that RCL’s P/E is lower because our peer group is overvalued by the market.
To help readers see pass the short term volatility of the financial market, we aim to bring you a long-term focused research analysis purely driven by fundamental data. Note that our analysis does not factor in the latest price sensitive company announcements.
The author is an independent contributor and at the time of publication had no position in the stocks mentioned.
