Does BE Semiconductor Industries N.V.’s (AMS:BESI) P/E Ratio Signal A Buying Opportunity?

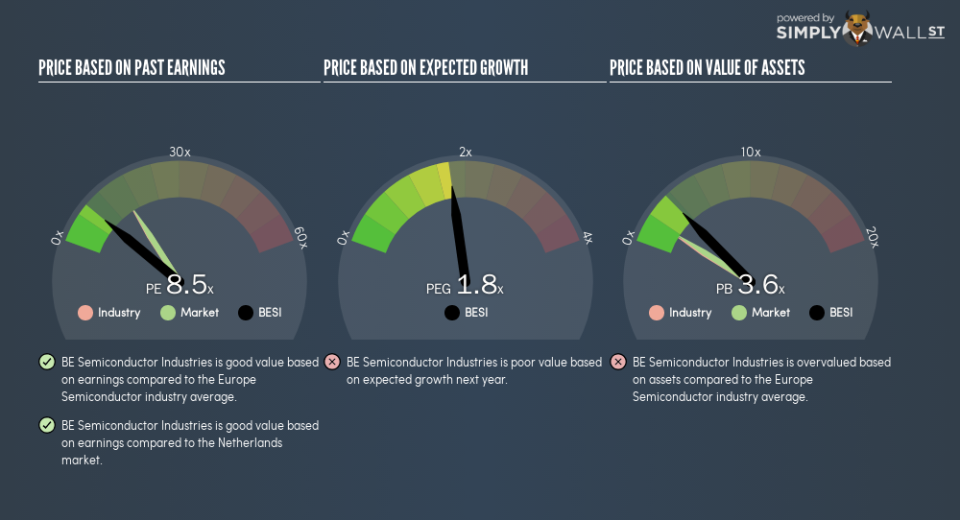
The goal of this article is to teach you how to use price to earnings ratios (P/E ratios). We’ll show how you can use BE Semiconductor Industries N.V.’s (AMS:BESI) P/E ratio to inform your assessment of the investment opportunity. BE Semiconductor Industries has a P/E ratio of 8.47, based on the last twelve months. That is equivalent to an earnings yield of about 12%.
Check out our latest analysis for BE Semiconductor Industries
How Do I Calculate A Price To Earnings Ratio?
The formula for P/E is:
Price to Earnings Ratio = Share Price ÷ Earnings per Share (EPS)
Or for BE Semiconductor Industries:
P/E of 8.47 = €17.81 ÷ €2.1 (Based on the trailing twelve months to September 2018.)
Is A High Price-to-Earnings Ratio Good?
A higher P/E ratio means that buyers have to pay a higher price for each €1 the company has earned over the last year. All else being equal, it’s better to pay a low price — but as Warren Buffett said, ‘It’s far better to buy a wonderful company at a fair price than a fair company at a wonderful price.’
How Growth Rates Impact P/E Ratios
P/E ratios primarily reflect market expectations around earnings growth rates. When earnings grow, the ‘E’ increases, over time. That means unless the share price increases, the P/E will reduce in a few years. Then, a lower P/E should attract more buyers, pushing the share price up.
BE Semiconductor Industries increased earnings per share by 7.5% last year. And earnings per share have improved by 38% annually, over the last five years.
How Does BE Semiconductor Industries’s P/E Ratio Compare To Its Peers?
We can get an indication of market expectations by looking at the P/E ratio. We can see in the image below that the average P/E (15.9) for companies in the semiconductor industry is higher than BE Semiconductor Industries’s P/E.
BE Semiconductor Industries’s P/E tells us that market participants think it will not fare as well as its peers in the same industry. While current expectations are low, the stock could be undervalued if the situation is better than the market assumes. It is arguably worth checking if insiders are buying shares, because that might imply they believe the stock is undervalued.
Remember: P/E Ratios Don’t Consider The Balance Sheet
Don’t forget that the P/E ratio considers market capitalization. In other words, it does not consider any debt or cash that the company may have on the balance sheet. Hypothetically, a company could reduce its future P/E ratio by spending its cash (or taking on debt) to achieve higher earnings.
Such spending might be good or bad, overall, but the key point here is that you need to look at debt to understand the P/E ratio in context.
How Does BE Semiconductor Industries’s Debt Impact Its P/E Ratio?
The extra options and safety that comes with BE Semiconductor Industries’s €160m net cash position means that it deserves a higher P/E than it would if it had a lot of net debt.
The Bottom Line On BE Semiconductor Industries’s P/E Ratio
BE Semiconductor Industries has a P/E of 8.5. That’s below the average in the NL market, which is 15.7. EPS was up modestly better over the last twelve months. Also positive, the relatively strong balance sheet will allow for investment in growth. In contrast, the P/E indicates shareholders doubt that will happen!
Investors have an opportunity when market expectations about a stock are wrong. If the reality for a company is not as bad as the P/E ratio indicates, then the share price should increase as the market realizes this. So this free visualization of the analyst consensus on future earnings could help you make the right decision about whether to buy, sell, or hold.
But note: BE Semiconductor Industries may not be the best stock to buy. So take a peek at this free list of interesting companies with strong recent earnings growth (and a P/E ratio below 20).
To help readers see past the short term volatility of the financial market, we aim to bring you a long-term focused research analysis purely driven by fundamental data. Note that our analysis does not factor in the latest price-sensitive company announcements.
The author is an independent contributor and at the time of publication had no position in the stocks mentioned. For errors that warrant correction please contact the editor at editorial-team@simplywallst.com.
