Does Terraco Gold Corp’s (CVE:TEN) PE Ratio Signal A Buying Opportunity?

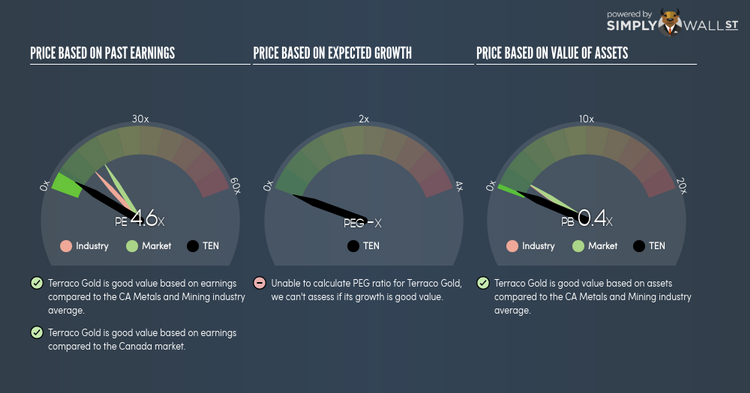
Terraco Gold Corp (TSXV:TEN) trades with a trailing P/E of 4.6x, which is lower than the industry average of 11.7x. Although some investors may jump to the conclusion that this is a great buying opportunity, understanding the assumptions behind the P/E ratio might change your mind. In this article, I will break down what the P/E ratio is, how to interpret it and what to watch out for. View our latest analysis for Terraco Gold
Demystifying the P/E ratio
P/E is often used for relative valuation since earnings power is a chief driver of investment value. It compares a stock’s price per share to the stock’s earnings per share. A more intuitive way of understanding the P/E ratio is to think of it as how much investors are paying for each dollar of the company’s earnings.
P/E Calculation for TEN
Price-Earnings Ratio = Price per share ÷ Earnings per share
TEN Price-Earnings Ratio = CA$0.09 ÷ CA$0.02 = 4.6x
The P/E ratio itself doesn’t tell you a lot; however, it becomes very insightful when you compare it with other similar companies. We preferably want to compare the stock’s P/E ratio to the average of companies that have similar features to TEN, such as capital structure and profitability. A common peer group is companies that exist in the same industry, which is what I use. Since TEN’s P/E of 4.6x is lower than its industry peers (11.7x), it means that investors are paying less than they should for each dollar of TEN’s earnings. Therefore, according to this analysis, TEN is an under-priced stock.
Assumptions to be aware of
While our conclusion might prompt you to buy TEN immediately, there are two important assumptions you should be aware of. Firstly, our peer group contains companies that are similar to TEN. If this isn’t the case, the difference in P/E could be due to other factors. For example, if you are comparing lower risk firms with TEN, then its P/E would naturally be lower than its peers, as investors would value those with lower risk at a higher price. The second assumption that must hold true is that the stocks we are comparing TEN to are fairly valued by the market. If this is violated, TEN’s P/E may be lower than its peers as they are actually overvalued by investors.
What this means for you:
If your personal research into the stock confirms what the P/E ratio is telling you, it might be a good time to add more of TEN to your portfolio. But keep in mind that the usefulness of relative valuation depends on whether you are comfortable with making the assumptions I mentioned above. Remember that basing your investment decision off one metric alone is certainly not sufficient. There are many things I have not taken into account in this article and the PE ratio is very one-dimensional. If you have not done so already, I highly recommend you to complete your research by taking a look at the following:
Financial Health: Is TEN’s operations financially sustainable? Balance sheets can be hard to analyze, which is why we’ve done it for you. Check out our financial health checks here.
Past Track Record: Has TEN been consistently performing well irrespective of the ups and downs in the market? Go into more detail in the past performance analysis and take a look at the free visual representations of TEN’s historicals for more clarity.
Other High-Performing Stocks: Are there other stocks that provide better prospects with proven track records? Explore our free list of these great stocks here.
To help readers see pass the short term volatility of the financial market, we aim to bring you a long-term focused research analysis purely driven by fundamental data. Note that our analysis does not factor in the latest price sensitive company announcements.
The author is an independent contributor and at the time of publication had no position in the stocks mentioned.
