Does This Valuation Of Clearfield, Inc. (NASDAQ:CLFD) Imply Investors Are Overpaying?
Key Insights
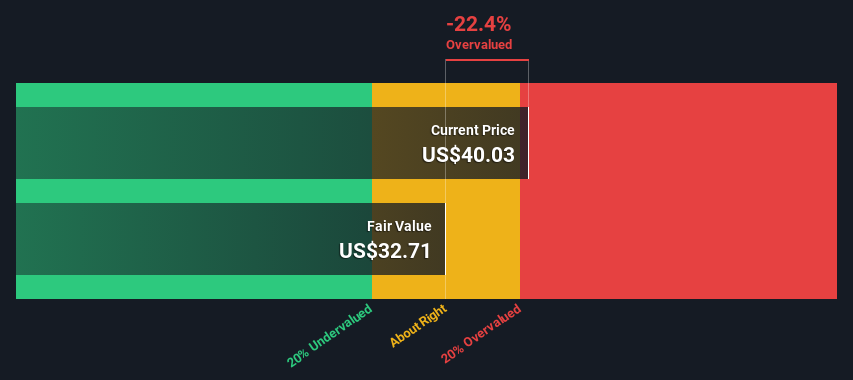
Using the 2 Stage Free Cash Flow to Equity, Clearfield fair value estimate is US$32.71
Clearfield's US$40.03 share price signals that it might be 22% overvalued
The US$48.75 analyst price target for CLFD is 49% more than our estimate of fair value
Today we'll do a simple run through of a valuation method used to estimate the attractiveness of Clearfield, Inc. (NASDAQ:CLFD) as an investment opportunity by projecting its future cash flows and then discounting them to today's value. We will use the Discounted Cash Flow (DCF) model on this occasion. Believe it or not, it's not too difficult to follow, as you'll see from our example!
Remember though, that there are many ways to estimate a company's value, and a DCF is just one method. Anyone interested in learning a bit more about intrinsic value should have a read of the Simply Wall St analysis model.
See our latest analysis for Clearfield
Step By Step Through The Calculation
We are going to use a two-stage DCF model, which, as the name states, takes into account two stages of growth. The first stage is generally a higher growth period which levels off heading towards the terminal value, captured in the second 'steady growth' period. To start off with, we need to estimate the next ten years of cash flows. Seeing as no analyst estimates of free cash flow are available to us, we have extrapolate the previous free cash flow (FCF) from the company's last reported value. We assume companies with shrinking free cash flow will slow their rate of shrinkage, and that companies with growing free cash flow will see their growth rate slow, over this period. We do this to reflect that growth tends to slow more in the early years than it does in later years.
Generally we assume that a dollar today is more valuable than a dollar in the future, so we discount the value of these future cash flows to their estimated value in today's dollars:
10-year free cash flow (FCF) forecast
2024 | 2025 | 2026 | 2027 | 2028 | 2029 | 2030 | 2031 | 2032 | 2033 | |
Levered FCF ($, Millions) | US$18.3m | US$21.0m | US$23.3m | US$25.2m | US$26.8m | US$28.2m | US$29.4m | US$30.5m | US$31.5m | US$32.4m |
Growth Rate Estimate Source | Est @ 20.16% | Est @ 14.76% | Est @ 10.98% | Est @ 8.33% | Est @ 6.47% | Est @ 5.18% | Est @ 4.27% | Est @ 3.63% | Est @ 3.19% | Est @ 2.88% |
Present Value ($, Millions) Discounted @ 7.3% | US$17.0 | US$18.2 | US$18.9 | US$19.0 | US$18.9 | US$18.5 | US$18.0 | US$17.4 | US$16.7 | US$16.1 |
("Est" = FCF growth rate estimated by Simply Wall St)
Present Value of 10-year Cash Flow (PVCF) = US$179m
We now need to calculate the Terminal Value, which accounts for all the future cash flows after this ten year period. For a number of reasons a very conservative growth rate is used that cannot exceed that of a country's GDP growth. In this case we have used the 5-year average of the 10-year government bond yield (2.2%) to estimate future growth. In the same way as with the 10-year 'growth' period, we discount future cash flows to today's value, using a cost of equity of 7.3%.
Terminal Value (TV)= FCF2033 × (1 + g) ÷ (r – g) = US$32m× (1 + 2.2%) ÷ (7.3%– 2.2%) = US$646m
Present Value of Terminal Value (PVTV)= TV / (1 + r)10= US$646m÷ ( 1 + 7.3%)10= US$320m
The total value is the sum of cash flows for the next ten years plus the discounted terminal value, which results in the Total Equity Value, which in this case is US$499m. The last step is to then divide the equity value by the number of shares outstanding. Relative to the current share price of US$40.0, the company appears slightly overvalued at the time of writing. Remember though, that this is just an approximate valuation, and like any complex formula - garbage in, garbage out.
Important Assumptions
We would point out that the most important inputs to a discounted cash flow are the discount rate and of course the actual cash flows. You don't have to agree with these inputs, I recommend redoing the calculations yourself and playing with them. The DCF also does not consider the possible cyclicality of an industry, or a company's future capital requirements, so it does not give a full picture of a company's potential performance. Given that we are looking at Clearfield as potential shareholders, the cost of equity is used as the discount rate, rather than the cost of capital (or weighted average cost of capital, WACC) which accounts for debt. In this calculation we've used 7.3%, which is based on a levered beta of 1.024. Beta is a measure of a stock's volatility, compared to the market as a whole. We get our beta from the industry average beta of globally comparable companies, with an imposed limit between 0.8 and 2.0, which is a reasonable range for a stable business.
SWOT Analysis for Clearfield
Strength
Earnings growth over the past year exceeded the industry.
Debt is not viewed as a risk.
Weakness
Earnings growth over the past year is below its 5-year average.
Expensive based on P/E ratio and estimated fair value.
Shareholders have been diluted in the past year.
Opportunity
CLFD's financial characteristics indicate limited near-term opportunities for shareholders.
Threat
Annual earnings are forecast to decline for the next 2 years.
Next Steps:
Although the valuation of a company is important, it is only one of many factors that you need to assess for a company. It's not possible to obtain a foolproof valuation with a DCF model. Rather it should be seen as a guide to "what assumptions need to be true for this stock to be under/overvalued?" For example, changes in the company's cost of equity or the risk free rate can significantly impact the valuation. Can we work out why the company is trading at a premium to intrinsic value? For Clearfield, there are three important factors you should look at:
Risks: Consider for instance, the ever-present spectre of investment risk. We've identified 3 warning signs with Clearfield (at least 2 which are potentially serious) , and understanding them should be part of your investment process.
Future Earnings: How does CLFD's growth rate compare to its peers and the wider market? Dig deeper into the analyst consensus number for the upcoming years by interacting with our free analyst growth expectation chart.
Other High Quality Alternatives: Do you like a good all-rounder? Explore our interactive list of high quality stocks to get an idea of what else is out there you may be missing!
PS. Simply Wall St updates its DCF calculation for every American stock every day, so if you want to find the intrinsic value of any other stock just search here.
Have feedback on this article? Concerned about the content? Get in touch with us directly. Alternatively, email editorial-team (at) simplywallst.com.
This article by Simply Wall St is general in nature. We provide commentary based on historical data and analyst forecasts only using an unbiased methodology and our articles are not intended to be financial advice. It does not constitute a recommendation to buy or sell any stock, and does not take account of your objectives, or your financial situation. We aim to bring you long-term focused analysis driven by fundamental data. Note that our analysis may not factor in the latest price-sensitive company announcements or qualitative material. Simply Wall St has no position in any stocks mentioned.
