Does This Valuation Of Comfort Systems USA, Inc. (NYSE:FIX) Imply Investors Are Overpaying?
Key Insights
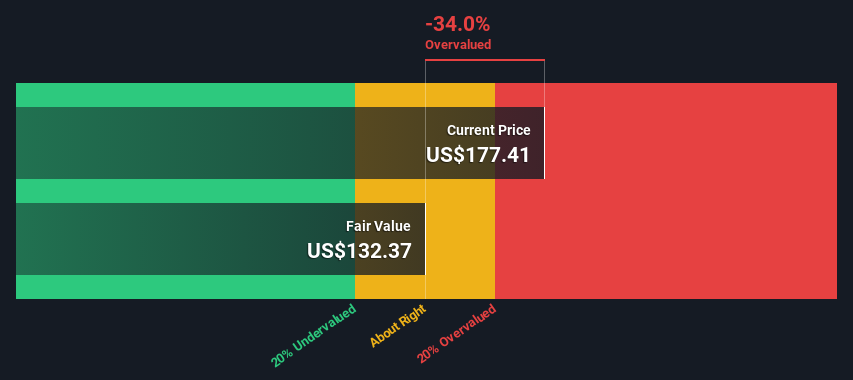
Comfort Systems USA's estimated fair value is US$132 based on 2 Stage Free Cash Flow to Equity
Comfort Systems USA is estimated to be 34% overvalued based on current share price of US$177
Analyst price target for FIX is US$186, which is 40% above our fair value estimate
Today we will run through one way of estimating the intrinsic value of Comfort Systems USA, Inc. (NYSE:FIX) by taking the expected future cash flows and discounting them to their present value. The Discounted Cash Flow (DCF) model is the tool we will apply to do this. Don't get put off by the jargon, the math behind it is actually quite straightforward.
We would caution that there are many ways of valuing a company and, like the DCF, each technique has advantages and disadvantages in certain scenarios. Anyone interested in learning a bit more about intrinsic value should have a read of the Simply Wall St analysis model.
See our latest analysis for Comfort Systems USA
Is Comfort Systems USA Fairly Valued?
We use what is known as a 2-stage model, which simply means we have two different periods of growth rates for the company's cash flows. Generally the first stage is higher growth, and the second stage is a lower growth phase. In the first stage we need to estimate the cash flows to the business over the next ten years. Where possible we use analyst estimates, but when these aren't available we extrapolate the previous free cash flow (FCF) from the last estimate or reported value. We assume companies with shrinking free cash flow will slow their rate of shrinkage, and that companies with growing free cash flow will see their growth rate slow, over this period. We do this to reflect that growth tends to slow more in the early years than it does in later years.
Generally we assume that a dollar today is more valuable than a dollar in the future, so we need to discount the sum of these future cash flows to arrive at a present value estimate:
10-year free cash flow (FCF) forecast
2024 | 2025 | 2026 | 2027 | 2028 | 2029 | 2030 | 2031 | 2032 | 2033 | |
Levered FCF ($, Millions) | US$316.5m | US$291.6m | US$277.3m | US$269.6m | US$266.2m | US$265.5m | US$266.7m | US$269.3m | US$272.8m | US$277.1m |
Growth Rate Estimate Source | Analyst x2 | Est @ -7.89% | Est @ -4.88% | Est @ -2.77% | Est @ -1.29% | Est @ -0.26% | Est @ 0.46% | Est @ 0.97% | Est @ 1.32% | Est @ 1.57% |
Present Value ($, Millions) Discounted @ 7.2% | US$295 | US$254 | US$225 | US$204 | US$188 | US$175 | US$164 | US$154 | US$146 | US$138 |
("Est" = FCF growth rate estimated by Simply Wall St)
Present Value of 10-year Cash Flow (PVCF) = US$1.9b
We now need to calculate the Terminal Value, which accounts for all the future cash flows after this ten year period. The Gordon Growth formula is used to calculate Terminal Value at a future annual growth rate equal to the 5-year average of the 10-year government bond yield of 2.2%. We discount the terminal cash flows to today's value at a cost of equity of 7.2%.
Terminal Value (TV)= FCF2033 × (1 + g) ÷ (r – g) = US$277m× (1 + 2.2%) ÷ (7.2%– 2.2%) = US$5.6b
Present Value of Terminal Value (PVTV)= TV / (1 + r)10= US$5.6b÷ ( 1 + 7.2%)10= US$2.8b
The total value is the sum of cash flows for the next ten years plus the discounted terminal value, which results in the Total Equity Value, which in this case is US$4.7b. In the final step we divide the equity value by the number of shares outstanding. Compared to the current share price of US$177, the company appears potentially overvalued at the time of writing. The assumptions in any calculation have a big impact on the valuation, so it is better to view this as a rough estimate, not precise down to the last cent.
Important Assumptions
Now the most important inputs to a discounted cash flow are the discount rate, and of course, the actual cash flows. If you don't agree with these result, have a go at the calculation yourself and play with the assumptions. The DCF also does not consider the possible cyclicality of an industry, or a company's future capital requirements, so it does not give a full picture of a company's potential performance. Given that we are looking at Comfort Systems USA as potential shareholders, the cost of equity is used as the discount rate, rather than the cost of capital (or weighted average cost of capital, WACC) which accounts for debt. In this calculation we've used 7.2%, which is based on a levered beta of 1.014. Beta is a measure of a stock's volatility, compared to the market as a whole. We get our beta from the industry average beta of globally comparable companies, with an imposed limit between 0.8 and 2.0, which is a reasonable range for a stable business.
SWOT Analysis for Comfort Systems USA
Strength
Debt is not viewed as a risk.
Weakness
Earnings growth over the past year underperformed the Construction industry.
Dividend is low compared to the top 25% of dividend payers in the Construction market.
Expensive based on P/E ratio and estimated fair value.
Opportunity
Annual earnings are forecast to grow for the next 3 years.
Threat
Annual earnings are forecast to grow slower than the American market.
Next Steps:
Although the valuation of a company is important, it ideally won't be the sole piece of analysis you scrutinize for a company. It's not possible to obtain a foolproof valuation with a DCF model. Preferably you'd apply different cases and assumptions and see how they would impact the company's valuation. For example, changes in the company's cost of equity or the risk free rate can significantly impact the valuation. Why is the intrinsic value lower than the current share price? For Comfort Systems USA, we've put together three additional factors you should further examine:
Financial Health: Does FIX have a healthy balance sheet? Take a look at our free balance sheet analysis with six simple checks on key factors like leverage and risk.
Management:Have insiders been ramping up their shares to take advantage of the market's sentiment for FIX's future outlook? Check out our management and board analysis with insights on CEO compensation and governance factors.
Other Solid Businesses: Low debt, high returns on equity and good past performance are fundamental to a strong business. Why not explore our interactive list of stocks with solid business fundamentals to see if there are other companies you may not have considered!
PS. Simply Wall St updates its DCF calculation for every American stock every day, so if you want to find the intrinsic value of any other stock just search here.
Have feedback on this article? Concerned about the content? Get in touch with us directly. Alternatively, email editorial-team (at) simplywallst.com.
This article by Simply Wall St is general in nature. We provide commentary based on historical data and analyst forecasts only using an unbiased methodology and our articles are not intended to be financial advice. It does not constitute a recommendation to buy or sell any stock, and does not take account of your objectives, or your financial situation. We aim to bring you long-term focused analysis driven by fundamental data. Note that our analysis may not factor in the latest price-sensitive company announcements or qualitative material. Simply Wall St has no position in any stocks mentioned.
