How Does Warpaint London's (LON:W7L) P/E Compare To Its Industry, After Its Big Share Price Gain?

Warpaint London (LON:W7L) shareholders are no doubt pleased to see that the share price has bounced 31% in the last month alone, although it is still down 20% over the last quarter. However, that doesn't change the fact that longer term shareholders might have been mercilessly wrecked by the 70% share price decline throughout the year.
Assuming no other changes, a sharply higher share price makes a stock less attractive to potential buyers. In the long term, share prices tend to follow earnings per share, but in the short term prices bounce around in response to short term factors (which are not always obvious). The implication here is that deep value investors might steer clear when expectations of a company are too high. One way to gauge market expectations of a stock is to look at its Price to Earnings Ratio (PE Ratio). A high P/E implies that investors have high expectations of what a company can achieve compared to a company with a low P/E ratio.
View our latest analysis for Warpaint London
Does Warpaint London Have A Relatively High Or Low P/E For Its Industry?
Warpaint London's P/E is 22.38. The image below shows that Warpaint London has a P/E ratio that is roughly in line with the personal products industry average (21.4).
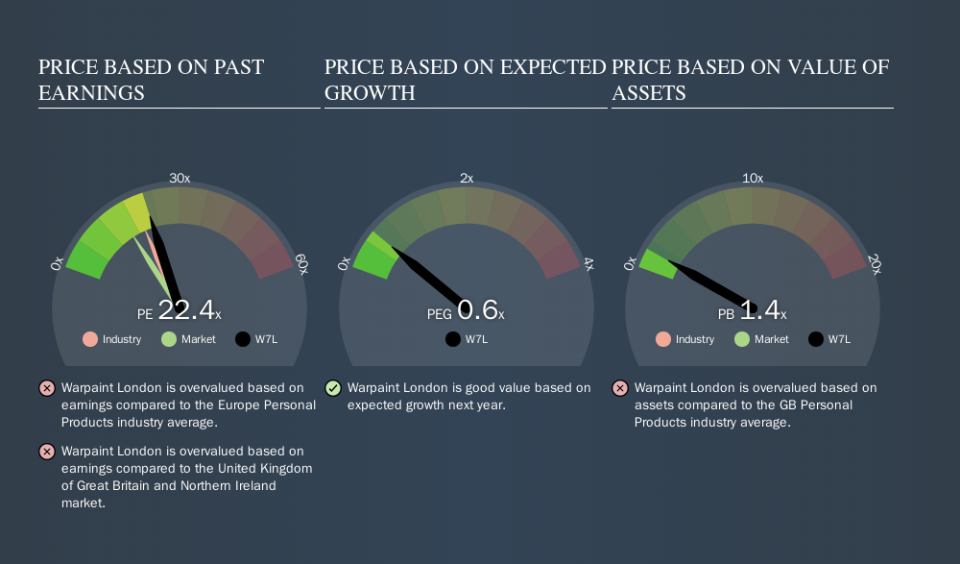
That indicates that the market expects Warpaint London will perform roughly in line with other companies in its industry. The company could surprise by performing better than average, in the future. Checking factors such as director buying and selling. could help you form your own view on if that will happen.
How Growth Rates Impact P/E Ratios
If earnings fall then in the future the 'E' will be lower. Therefore, even if you pay a low multiple of earnings now, that multiple will become higher in the future. Then, a higher P/E might scare off shareholders, pushing the share price down.
Warpaint London shrunk earnings per share by 47% over the last year. And EPS is down 26% a year, over the last 3 years. This growth rate might warrant a low P/E ratio.
Don't Forget: The P/E Does Not Account For Debt or Bank Deposits
One drawback of using a P/E ratio is that it considers market capitalization, but not the balance sheet. So it won't reflect the advantage of cash, or disadvantage of debt. Hypothetically, a company could reduce its future P/E ratio by spending its cash (or taking on debt) to achieve higher earnings.
While growth expenditure doesn't always pay off, the point is that it is a good option to have; but one that the P/E ratio ignores.
So What Does Warpaint London's Balance Sheet Tell Us?
Warpaint London has net cash of UK£2.4m. That should lead to a higher P/E than if it did have debt, because its strong balance sheets gives it more options.
The Verdict On Warpaint London's P/E Ratio
Warpaint London has a P/E of 22.4. That's higher than the average in its market, which is 16.0. The recent drop in earnings per share would make some investors cautious, but the net cash position means the company has time to improve: and the high P/E suggests the market thinks it will. What we know for sure is that investors have become much more excited about Warpaint London recently, since they have pushed its P/E ratio from 17.0 to 22.4 over the last month. For those who prefer to invest with the flow of momentum, that might mean it's time to put the stock on a watchlist, or research it. But the contrarian may see it as a missed opportunity.
Investors have an opportunity when market expectations about a stock are wrong. People often underestimate remarkable growth -- so investors can make money when fast growth is not fully appreciated. So this free report on the analyst consensus forecasts could help you make a master move on this stock.
Of course, you might find a fantastic investment by looking at a few good candidates. So take a peek at this free list of companies with modest (or no) debt, trading on a P/E below 20.
We aim to bring you long-term focused research analysis driven by fundamental data. Note that our analysis may not factor in the latest price-sensitive company announcements or qualitative material.
If you spot an error that warrants correction, please contact the editor at editorial-team@simplywallst.com. This article by Simply Wall St is general in nature. It does not constitute a recommendation to buy or sell any stock, and does not take account of your objectives, or your financial situation. Simply Wall St has no position in the stocks mentioned. Thank you for reading.
