Does WMIH Corp’s (WMIH) PE Ratio Signal A Buying Opportunity?

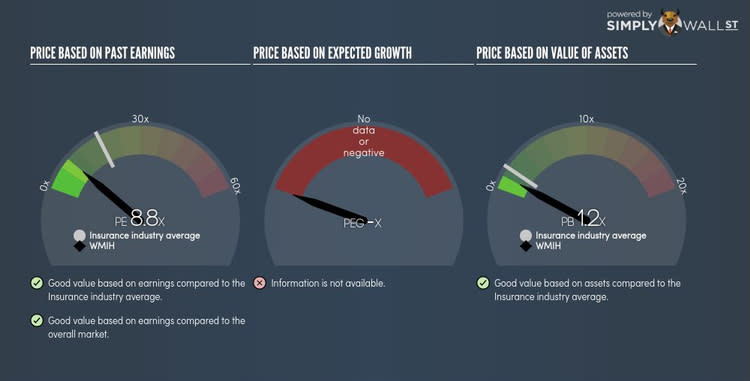
WMIH Corp (NASDAQ:WMIH) trades with a trailing P/E of 8.8x, which is lower than the industry average of 16.1x. While WMIH might seem like an attractive stock to buy, it is important to understand the assumptions behind the P/E ratio before you make any investment decisions. In this article, I will break down what the P/E ratio is, how to interpret it and what to watch out for. Check out our latest analysis for WMIH
Breaking down the Price-Earnings ratio
The P/E ratio is one of many ratios used in relative valuation. By comparing a stock’s price per share to its earnings per share, we are able to see how much investors are paying for each dollar of the company’s earnings.
Formula
Price-Earnings Ratio = Price per share ÷ Earnings per share
P/E Calculation for WMIH
Price per share = 1.1
Earnings per share = 0.125
∴ Price-Earnings Ratio = 1.1 ÷ 0.125 = 8.8x
The P/E ratio isn’t a metric you view in isolation and only becomes useful when you compare it against other similar companies. Ultimately, our goal is to compare the stock’s P/E ratio to the average of companies that have similar attributes to WMIH, such as company lifetime and products sold. One way of gathering a peer group is to use firms in the same industry, which is what I’ll do. Since it is expected that similar companies have similar P/E ratios, we can come to some conclusions about the stock if the ratios are different.
Since WMIH's P/E of 8.8x is lower than its industry peers (16.1x), it means that investors are paying less than they should for each dollar of WMIH's earnings. As such, our analysis shows that WMIH represents an under-priced stock.
Assumptions to watch out for
Before you jump to the conclusion that WMIH represents the perfect buying opportunity, it is important to realise that our conclusion rests on two important assertions. The first is that our peer group actually contains companies that are similar to WMIH. If this isn’t the case, the difference in P/E could be due to some other factors. For example, if you accidentally compared higher growth firms with WMIH, then WMIH’s P/E would naturally be lower since investors would reward its peers’ higher growth with a higher price. Alternatively, if you inadvertently compared less risky firms with WMIH, WMIH’s P/E would again be lower since investors would reward its peers’ lower risk with a higher price as well. The second assumption that must hold true is that the stocks we are comparing WMIH to are fairly valued by the market. If this assumption is violated, WMIH's P/E may be lower than its peers because its peers are actually overvalued by investors.
What this means for you:
Are you a shareholder? Since you may have already conducted your due diligence on WMIH, the undervaluation of the stock may mean it is a good time to top up on your current holdings. But at the end of the day, keep in mind that relative valuation relies heavily on critical assumptions I've outlined above.
Are you a potential investor? If WMIH has been on your watch list for a while, it is best you also consider its intrinsic valuation. Looking at PE on its own will not give you the full picture of the stock as an investment, so I suggest you should also look at other relative valuation metrics like EV/EBITDA or PEG.
PE is one aspect of your portfolio construction to consider when holding or entering into a stock. But it is certainly not the only factor. Take a look at our most recent infographic report on WMIH for a more in-depth analysis of the stock to help you make a well-informed investment decision. Since we know a limitation of PE is it doesn't properly account for growth, you can use our free platform to see my list of stocks with a high growth potential and see if their PE is still reasonable.
To help readers see pass the short term volatility of the financial market, we aim to bring you a long-term focused research analysis purely driven by fundamental data. Note that our analysis does not factor in the latest price sensitive company announcements.
The author is an independent contributor and at the time of publication had no position in the stocks mentioned.
