Does WSFS Financial Corporation's (NASDAQ:WSFS) P/E Ratio Signal A Buying Opportunity?

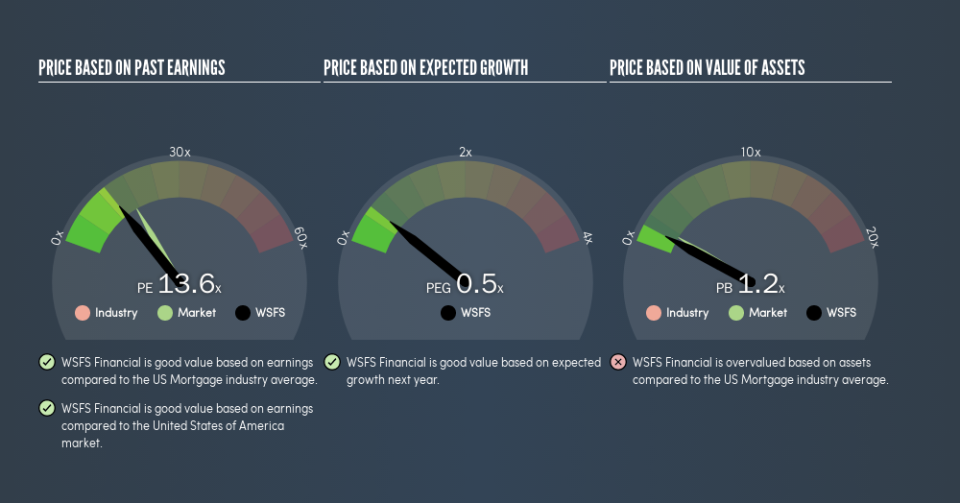
The goal of this article is to teach you how to use price to earnings ratios (P/E ratios). We'll show how you can use WSFS Financial Corporation's (NASDAQ:WSFS) P/E ratio to inform your assessment of the investment opportunity. WSFS Financial has a P/E ratio of 13.56, based on the last twelve months. That means that at current prices, buyers pay $13.56 for every $1 in trailing yearly profits.
View our latest analysis for WSFS Financial
How Do You Calculate A P/E Ratio?
The formula for P/E is:
Price to Earnings Ratio = Share Price ÷ Earnings per Share (EPS)
Or for WSFS Financial:
P/E of 13.56 = $41.12 ÷ $3.03 (Based on the year to June 2019.)
Is A High Price-to-Earnings Ratio Good?
The higher the P/E ratio, the higher the price tag of a business, relative to its trailing earnings. That isn't necessarily good or bad, but a high P/E implies relatively high expectations of what a company can achieve in the future.
How Does WSFS Financial's P/E Ratio Compare To Its Peers?
One good way to get a quick read on what market participants expect of a company is to look at its P/E ratio. As you can see below WSFS Financial has a P/E ratio that is fairly close for the average for the mortgage industry, which is 13.8.
Its P/E ratio suggests that WSFS Financial shareholders think that in the future it will perform about the same as other companies in its industry classification. The company could surprise by performing better than average, in the future. Further research into factors such as insider buying and selling, could help you form your own view on whether that is likely.
How Growth Rates Impact P/E Ratios
Earnings growth rates have a big influence on P/E ratios. Earnings growth means that in the future the 'E' will be higher. That means even if the current P/E is high, it will reduce over time if the share price stays flat. A lower P/E should indicate the stock is cheap relative to others -- and that may attract buyers.
WSFS Financial increased earnings per share by an impressive 24% over the last twelve months. And earnings per share have improved by 7.8% annually, over the last five years. With that performance, you might expect an above average P/E ratio.
Don't Forget: The P/E Does Not Account For Debt or Bank Deposits
Don't forget that the P/E ratio considers market capitalization. That means it doesn't take debt or cash into account. Hypothetically, a company could reduce its future P/E ratio by spending its cash (or taking on debt) to achieve higher earnings.
Such spending might be good or bad, overall, but the key point here is that you need to look at debt to understand the P/E ratio in context.
So What Does WSFS Financial's Balance Sheet Tell Us?
Since WSFS Financial holds net cash of US$107m, it can spend on growth, justifying a higher P/E ratio than otherwise.
The Verdict On WSFS Financial's P/E Ratio
WSFS Financial's P/E is 13.6 which is below average (17) in the US market. The net cash position gives plenty of options to the business, and the recent improvement in EPS is good to see. The relatively low P/E ratio implies the market is pessimistic. Given analysts are expecting further growth, one I would have expected a higher P/E ratio. So this stock may well be worth further research.
When the market is wrong about a stock, it gives savvy investors an opportunity. If it is underestimating a company, investors can make money by buying and holding the shares until the market corrects itself. So this free report on the analyst consensus forecasts could help you make a master move on this stock.
Of course you might be able to find a better stock than WSFS Financial. So you may wish to see this free collection of other companies that have grown earnings strongly.
We aim to bring you long-term focused research analysis driven by fundamental data. Note that our analysis may not factor in the latest price-sensitive company announcements or qualitative material.
If you spot an error that warrants correction, please contact the editor at editorial-team@simplywallst.com. This article by Simply Wall St is general in nature. It does not constitute a recommendation to buy or sell any stock, and does not take account of your objectives, or your financial situation. Simply Wall St has no position in the stocks mentioned. Thank you for reading.
