Does Xref (ASX:XF1) Have A Healthy Balance Sheet?
David Iben put it well when he said, 'Volatility is not a risk we care about. What we care about is avoiding the permanent loss of capital.' When we think about how risky a company is, we always like to look at its use of debt, since debt overload can lead to ruin. We can see that Xref Limited (ASX:XF1) does use debt in its business. But is this debt a concern to shareholders?
When Is Debt Dangerous?
Debt assists a business until the business has trouble paying it off, either with new capital or with free cash flow. Ultimately, if the company can't fulfill its legal obligations to repay debt, shareholders could walk away with nothing. However, a more usual (but still expensive) situation is where a company must dilute shareholders at a cheap share price simply to get debt under control. By replacing dilution, though, debt can be an extremely good tool for businesses that need capital to invest in growth at high rates of return. When we think about a company's use of debt, we first look at cash and debt together.
Check out our latest analysis for Xref
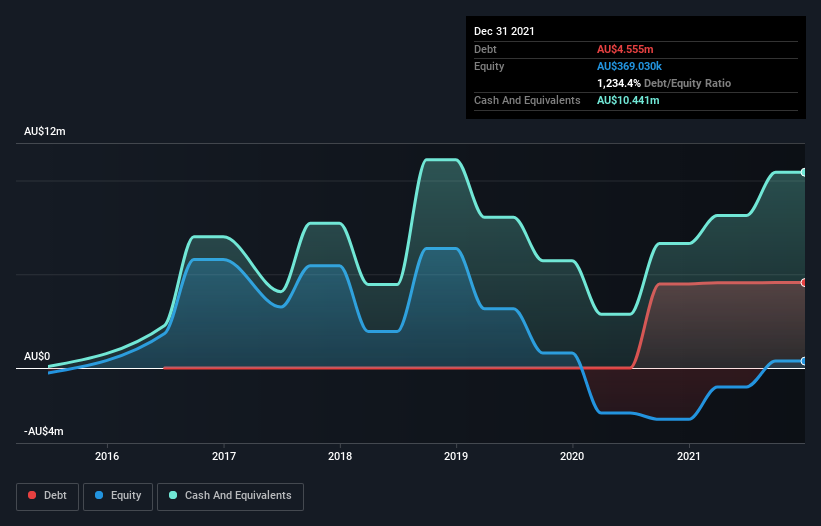
What Is Xref's Net Debt?
As you can see below, Xref had AU$4.56m of debt, at December 2021, which is about the same as the year before. You can click the chart for greater detail. But on the other hand it also has AU$10.4m in cash, leading to a AU$5.89m net cash position.
A Look At Xref's Liabilities
We can see from the most recent balance sheet that Xref had liabilities of AU$12.6m falling due within a year, and liabilities of AU$4.32m due beyond that. On the other hand, it had cash of AU$10.4m and AU$2.55m worth of receivables due within a year. So its liabilities total AU$3.96m more than the combination of its cash and short-term receivables.
Of course, Xref has a market capitalization of AU$109.3m, so these liabilities are probably manageable. Having said that, it's clear that we should continue to monitor its balance sheet, lest it change for the worse. While it does have liabilities worth noting, Xref also has more cash than debt, so we're pretty confident it can manage its debt safely.
It was also good to see that despite losing money on the EBIT line last year, Xref turned things around in the last 12 months, delivering and EBIT of AU$2.0m. There's no doubt that we learn most about debt from the balance sheet. But you can't view debt in total isolation; since Xref will need earnings to service that debt. So when considering debt, it's definitely worth looking at the earnings trend. Click here for an interactive snapshot.
Finally, a company can only pay off debt with cold hard cash, not accounting profits. While Xref has net cash on its balance sheet, it's still worth taking a look at its ability to convert earnings before interest and tax (EBIT) to free cash flow, to help us understand how quickly it is building (or eroding) that cash balance. Happily for any shareholders, Xref actually produced more free cash flow than EBIT over the last year. There's nothing better than incoming cash when it comes to staying in your lenders' good graces.
Summing up
We could understand if investors are concerned about Xref's liabilities, but we can be reassured by the fact it has has net cash of AU$5.89m. The cherry on top was that in converted 173% of that EBIT to free cash flow, bringing in AU$3.5m. So we don't think Xref's use of debt is risky. When analysing debt levels, the balance sheet is the obvious place to start. But ultimately, every company can contain risks that exist outside of the balance sheet. We've identified 2 warning signs with Xref , and understanding them should be part of your investment process.
Of course, if you're the type of investor who prefers buying stocks without the burden of debt, then don't hesitate to discover our exclusive list of net cash growth stocks, today.
Have feedback on this article? Concerned about the content? Get in touch with us directly. Alternatively, email editorial-team (at) simplywallst.com.
This article by Simply Wall St is general in nature. We provide commentary based on historical data and analyst forecasts only using an unbiased methodology and our articles are not intended to be financial advice. It does not constitute a recommendation to buy or sell any stock, and does not take account of your objectives, or your financial situation. We aim to bring you long-term focused analysis driven by fundamental data. Note that our analysis may not factor in the latest price-sensitive company announcements or qualitative material. Simply Wall St has no position in any stocks mentioned.
