How Does YETI Holdings's (NYSE:YETI) P/E Compare To Its Industry, After Its Big Share Price Gain?

Those holding YETI Holdings (NYSE:YETI) shares must be pleased that the share price has rebounded 24% in the last thirty days. But unfortunately, the stock is still down by 28% over a quarter. But shareholders may not all be feeling jubilant, since the share price is still down 25% in the last year.
Assuming no other changes, a sharply higher share price makes a stock less attractive to potential buyers. In the long term, share prices tend to follow earnings per share, but in the short term prices bounce around in response to short term factors (which are not always obvious). So some would prefer to hold off buying when there is a lot of optimism towards a stock. Perhaps the simplest way to get a read on investors' expectations of a business is to look at its Price to Earnings Ratio (PE Ratio). A high P/E implies that investors have high expectations of what a company can achieve compared to a company with a low P/E ratio.
Check out our latest analysis for YETI Holdings
How Does YETI Holdings's P/E Ratio Compare To Its Peers?
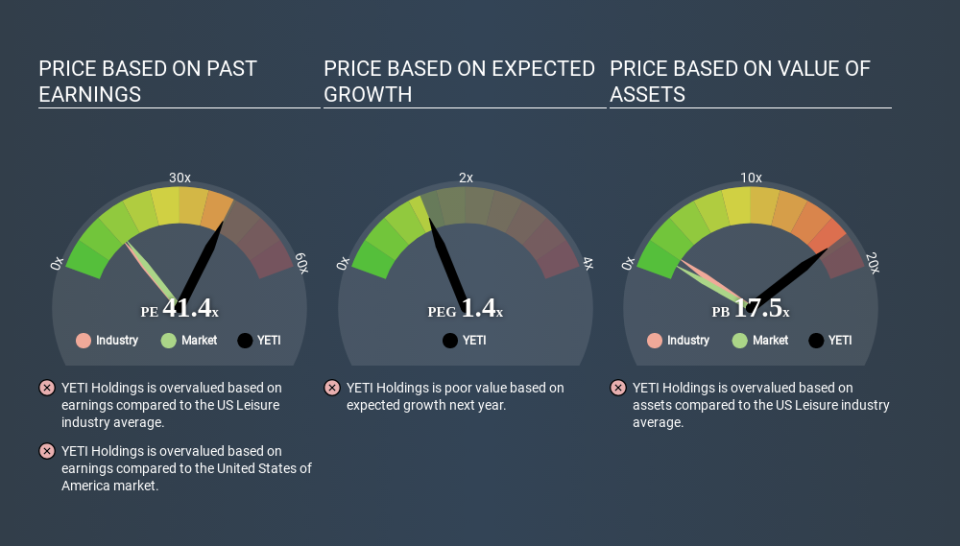
We can tell from its P/E ratio of 41.40 that there is some investor optimism about YETI Holdings. The image below shows that YETI Holdings has a significantly higher P/E than the average (12.9) P/E for companies in the leisure industry.
YETI Holdings's P/E tells us that market participants think the company will perform better than its industry peers, going forward. Clearly the market expects growth, but it isn't guaranteed. So investors should always consider the P/E ratio alongside other factors, such as whether company directors have been buying shares.
How Growth Rates Impact P/E Ratios
Probably the most important factor in determining what P/E a company trades on is the earnings growth. When earnings grow, the 'E' increases, over time. And in that case, the P/E ratio itself will drop rather quickly. A lower P/E should indicate the stock is cheap relative to others -- and that may attract buyers.
YETI Holdings saw earnings per share decrease by 16% last year. But EPS is up 27% over the last 5 years.
A Limitation: P/E Ratios Ignore Debt and Cash In The Bank
One drawback of using a P/E ratio is that it considers market capitalization, but not the balance sheet. In other words, it does not consider any debt or cash that the company may have on the balance sheet. Hypothetically, a company could reduce its future P/E ratio by spending its cash (or taking on debt) to achieve higher earnings.
Such expenditure might be good or bad, in the long term, but the point here is that the balance sheet is not reflected by this ratio.
Is Debt Impacting YETI Holdings's P/E?
Net debt totals 10% of YETI Holdings's market cap. It would probably deserve a higher P/E ratio if it was net cash, since it would have more options for growth.
The Bottom Line On YETI Holdings's P/E Ratio
YETI Holdings's P/E is 41.4 which is way above average (13.5) in its market. With some debt but no EPS growth last year, the market has high expectations of future profits. What we know for sure is that investors have become much more excited about YETI Holdings recently, since they have pushed its P/E ratio from 33.5 to 41.4 over the last month. If you like to buy stocks that have recently impressed the market, then this one might be a candidate; but if you prefer to invest when there is 'blood in the streets', then you may feel the opportunity has passed.
Investors have an opportunity when market expectations about a stock are wrong. As value investor Benjamin Graham famously said, 'In the short run, the market is a voting machine but in the long run, it is a weighing machine. So this free visual report on analyst forecasts could hold the key to an excellent investment decision.
Of course, you might find a fantastic investment by looking at a few good candidates. So take a peek at this free list of companies with modest (or no) debt, trading on a P/E below 20.
If you spot an error that warrants correction, please contact the editor at editorial-team@simplywallst.com. This article by Simply Wall St is general in nature. It does not constitute a recommendation to buy or sell any stock, and does not take account of your objectives, or your financial situation. Simply Wall St has no position in the stocks mentioned.
We aim to bring you long-term focused research analysis driven by fundamental data. Note that our analysis may not factor in the latest price-sensitive company announcements or qualitative material. Thank you for reading.
