Don't Sell ATN International, Inc. (NASDAQ:ATNI) Before You Read This

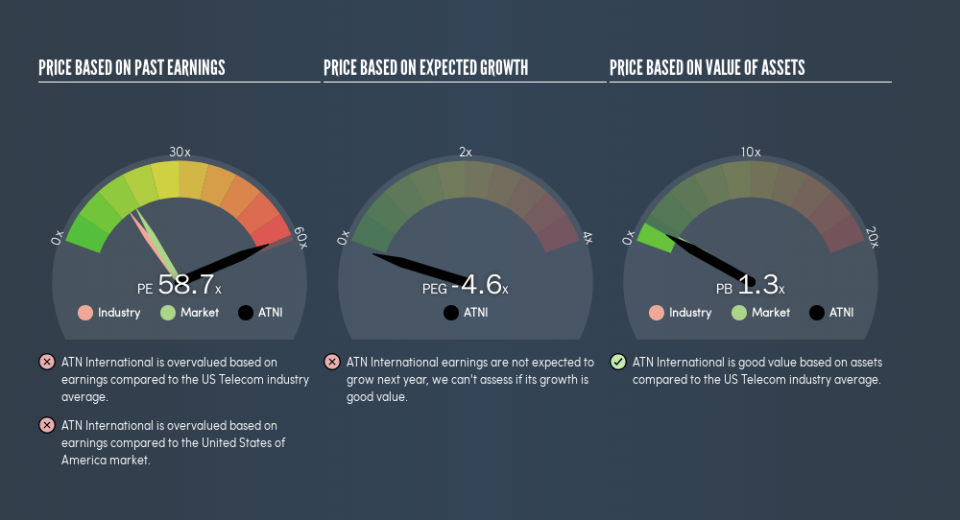
This article is written for those who want to get better at using price to earnings ratios (P/E ratios). To keep it practical, we'll show how ATN International, Inc.'s (NASDAQ:ATNI) P/E ratio could help you assess the value on offer. ATN International has a price to earnings ratio of 58.72, based on the last twelve months. That is equivalent to an earnings yield of about 1.7%.
See our latest analysis for ATN International
How Do I Calculate A Price To Earnings Ratio?
The formula for P/E is:
Price to Earnings Ratio = Price per Share ÷ Earnings per Share (EPS)
Or for ATN International:
P/E of 58.72 = $57.75 ÷ $0.98 (Based on the year to June 2019.)
Is A High P/E Ratio Good?
The higher the P/E ratio, the higher the price tag of a business, relative to its trailing earnings. That isn't a good or a bad thing on its own, but a high P/E means that buyers have a higher opinion of the business's prospects, relative to stocks with a lower P/E.
Does ATN International Have A Relatively High Or Low P/E For Its Industry?
The P/E ratio essentially measures market expectations of a company. As you can see below, ATN International has a much higher P/E than the average company (14.9) in the telecom industry.
Its relatively high P/E ratio indicates that ATN International shareholders think it will perform better than other companies in its industry classification. Shareholders are clearly optimistic, but the future is always uncertain. So investors should always consider the P/E ratio alongside other factors, such as whether company directors have been buying shares.
How Growth Rates Impact P/E Ratios
Probably the most important factor in determining what P/E a company trades on is the earnings growth. Earnings growth means that in the future the 'E' will be higher. And in that case, the P/E ratio itself will drop rather quickly. Then, a lower P/E should attract more buyers, pushing the share price up.
ATN International's earnings per share fell by 23% in the last twelve months. But EPS is up 6.5% over the last 3 years. And EPS is down 16% a year, over the last 5 years. This might lead to muted expectations.
A Limitation: P/E Ratios Ignore Debt and Cash In The Bank
Don't forget that the P/E ratio considers market capitalization. That means it doesn't take debt or cash into account. Hypothetically, a company could reduce its future P/E ratio by spending its cash (or taking on debt) to achieve higher earnings.
Spending on growth might be good or bad a few years later, but the point is that the P/E ratio does not account for the option (or lack thereof).
Is Debt Impacting ATN International's P/E?
The extra options and safety that comes with ATN International's US$62m net cash position means that it deserves a higher P/E than it would if it had a lot of net debt.
The Verdict On ATN International's P/E Ratio
With a P/E ratio of 58.7, ATN International is expected to grow earnings very strongly in the years to come. The recent drop in earnings per share would make some investors cautious, but the net cash position means the company has time to improve: and the high P/E suggests the market thinks it will.
Investors have an opportunity when market expectations about a stock are wrong. If the reality for a company is better than it expects, you can make money by buying and holding for the long term. So this free visualization of the analyst consensus on future earnings could help you make the right decision about whether to buy, sell, or hold.
Of course, you might find a fantastic investment by looking at a few good candidates. So take a peek at this free list of companies with modest (or no) debt, trading on a P/E below 20.
We aim to bring you long-term focused research analysis driven by fundamental data. Note that our analysis may not factor in the latest price-sensitive company announcements or qualitative material.
If you spot an error that warrants correction, please contact the editor at editorial-team@simplywallst.com. This article by Simply Wall St is general in nature. It does not constitute a recommendation to buy or sell any stock, and does not take account of your objectives, or your financial situation. Simply Wall St has no position in the stocks mentioned. Thank you for reading.
