Don't Sell MGM China Holdings Limited (HKG:2282) Before You Read This

The goal of this article is to teach you how to use price to earnings ratios (P/E ratios). We'll apply a basic P/E ratio analysis to MGM China Holdings Limited's (HKG:2282), to help you decide if the stock is worth further research. Based on the last twelve months, MGM China Holdings's P/E ratio is 33.66. That is equivalent to an earnings yield of about 3.0%.
View our latest analysis for MGM China Holdings
How Do I Calculate MGM China Holdings's Price To Earnings Ratio?
The formula for P/E is:
Price to Earnings Ratio = Share Price ÷ Earnings per Share (EPS)
Or for MGM China Holdings:
P/E of 33.66 = HK$12.28 ÷ HK$0.36 (Based on the trailing twelve months to June 2019.)
Is A High Price-to-Earnings Ratio Good?
A higher P/E ratio implies that investors pay a higher price for the earning power of the business. All else being equal, it's better to pay a low price -- but as Warren Buffett said, 'It's far better to buy a wonderful company at a fair price than a fair company at a wonderful price.
How Does MGM China Holdings's P/E Ratio Compare To Its Peers?
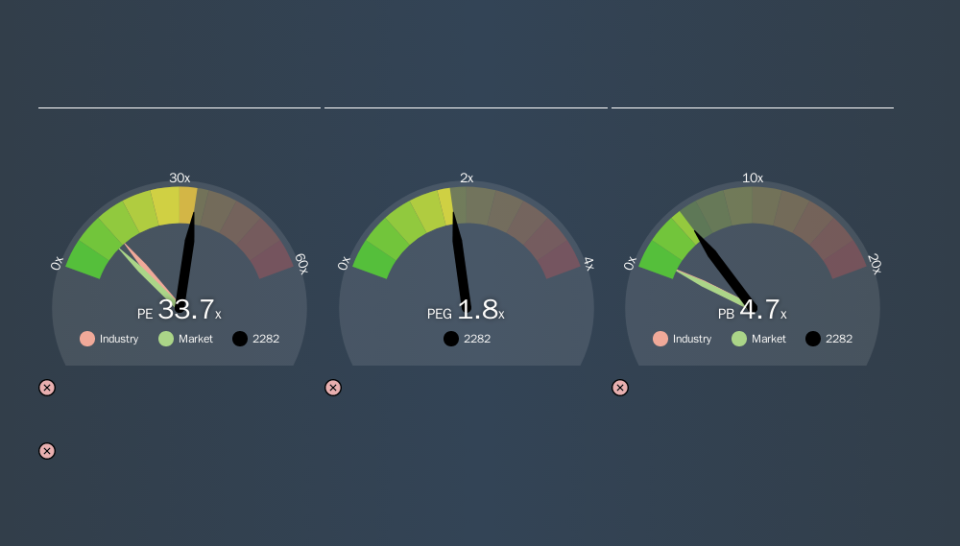
The P/E ratio essentially measures market expectations of a company. The image below shows that MGM China Holdings has a higher P/E than the average (12.7) P/E for companies in the hospitality industry.
MGM China Holdings's P/E tells us that market participants think the company will perform better than its industry peers, going forward. Clearly the market expects growth, but it isn't guaranteed. So investors should delve deeper. I like to check if company insiders have been buying or selling.
How Growth Rates Impact P/E Ratios
Companies that shrink earnings per share quickly will rapidly decrease the 'E' in the equation. That means unless the share price falls, the P/E will increase in a few years. So while a stock may look cheap based on past earnings, it could be expensive based on future earnings.
MGM China Holdings saw earnings per share decrease by 21% last year. And it has shrunk its earnings per share by 25% per year over the last five years. This growth rate might warrant a below average P/E ratio.
Remember: P/E Ratios Don't Consider The Balance Sheet
The 'Price' in P/E reflects the market capitalization of the company. Thus, the metric does not reflect cash or debt held by the company. The exact same company would hypothetically deserve a higher P/E ratio if it had a strong balance sheet, than if it had a weak one with lots of debt, because a cashed up company can spend on growth.
While growth expenditure doesn't always pay off, the point is that it is a good option to have; but one that the P/E ratio ignores.
So What Does MGM China Holdings's Balance Sheet Tell Us?
MGM China Holdings's net debt equates to 28% of its market capitalization. While that's enough to warrant consideration, it doesn't really concern us.
The Bottom Line On MGM China Holdings's P/E Ratio
MGM China Holdings trades on a P/E ratio of 33.7, which is multiples above its market average of 10.5. With modest debt but no EPS growth in the last year, it's fair to say the P/E implies some optimism about future earnings, from the market.
Investors should be looking to buy stocks that the market is wrong about. People often underestimate remarkable growth -- so investors can make money when fast growth is not fully appreciated. So this free visualization of the analyst consensus on future earnings could help you make the right decision about whether to buy, sell, or hold.
But note: MGM China Holdings may not be the best stock to buy. So take a peek at this free list of interesting companies with strong recent earnings growth (and a P/E ratio below 20).
We aim to bring you long-term focused research analysis driven by fundamental data. Note that our analysis may not factor in the latest price-sensitive company announcements or qualitative material.
If you spot an error that warrants correction, please contact the editor at editorial-team@simplywallst.com. This article by Simply Wall St is general in nature. It does not constitute a recommendation to buy or sell any stock, and does not take account of your objectives, or your financial situation. Simply Wall St has no position in the stocks mentioned. Thank you for reading.
