Don't Sell NewMarket Corporation (NYSE:NEU) Before You Read This

The goal of this article is to teach you how to use price to earnings ratios (P/E ratios). We'll show how you can use NewMarket Corporation's (NYSE:NEU) P/E ratio to inform your assessment of the investment opportunity. NewMarket has a P/E ratio of 20.44, based on the last twelve months. That is equivalent to an earnings yield of about 4.9%.
Check out our latest analysis for NewMarket
How Do I Calculate A Price To Earnings Ratio?
The formula for price to earnings is:
Price to Earnings Ratio = Price per Share ÷ Earnings per Share (EPS)
Or for NewMarket:
P/E of 20.44 = $487.05 ÷ $23.83 (Based on the year to September 2019.)
Is A High P/E Ratio Good?
A higher P/E ratio implies that investors pay a higher price for the earning power of the business. That is not a good or a bad thing per se, but a high P/E does imply buyers are optimistic about the future.
Does NewMarket Have A Relatively High Or Low P/E For Its Industry?
One good way to get a quick read on what market participants expect of a company is to look at its P/E ratio. You can see in the image below that the average P/E (20.2) for companies in the chemicals industry is roughly the same as NewMarket's P/E.
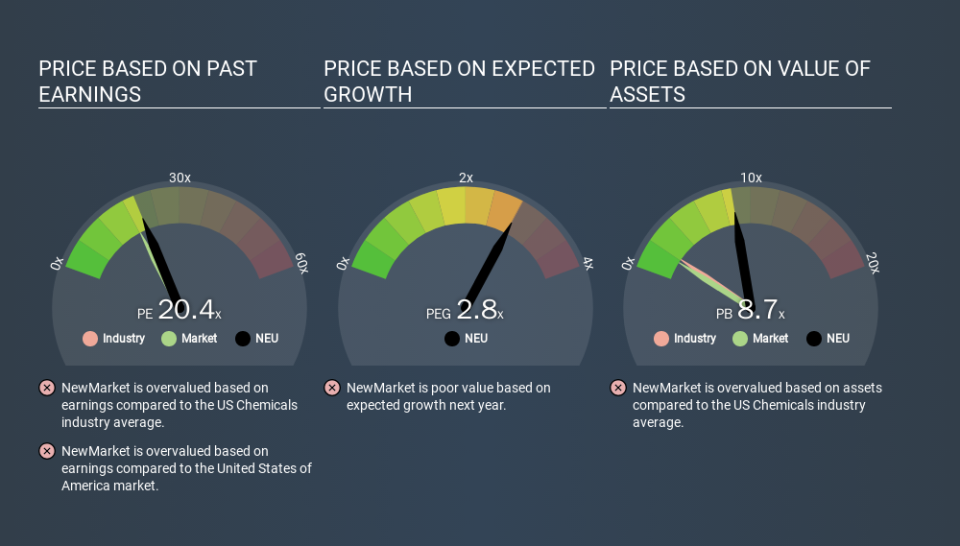
That indicates that the market expects NewMarket will perform roughly in line with other companies in its industry. So if NewMarket actually outperforms its peers going forward, that should be a positive for the share price. Further research into factors such as insider buying and selling, could help you form your own view on whether that is likely.
How Growth Rates Impact P/E Ratios
Probably the most important factor in determining what P/E a company trades on is the earnings growth. That's because companies that grow earnings per share quickly will rapidly increase the 'E' in the equation. That means even if the current P/E is high, it will reduce over time if the share price stays flat. And as that P/E ratio drops, the company will look cheap, unless its share price increases.
NewMarket's earnings made like a rocket, taking off 58% last year. Having said that, the average EPS growth over the last three years wasn't so good, coming in at 4.0%.
Remember: P/E Ratios Don't Consider The Balance Sheet
The 'Price' in P/E reflects the market capitalization of the company. Thus, the metric does not reflect cash or debt held by the company. The exact same company would hypothetically deserve a higher P/E ratio if it had a strong balance sheet, than if it had a weak one with lots of debt, because a cashed up company can spend on growth.
While growth expenditure doesn't always pay off, the point is that it is a good option to have; but one that the P/E ratio ignores.
NewMarket's Balance Sheet
NewMarket has net debt worth 10% of its market capitalization. That's enough debt to impact the P/E ratio a little; so keep it in mind if you're comparing it to companies without debt.
The Verdict On NewMarket's P/E Ratio
NewMarket trades on a P/E ratio of 20.4, which is above its market average of 18.3. While the company does use modest debt, its recent earnings growth is superb. So on this analysis a high P/E ratio seems reasonable.
Investors should be looking to buy stocks that the market is wrong about. People often underestimate remarkable growth -- so investors can make money when fast growth is not fully appreciated. So this free visualization of the analyst consensus on future earnings could help you make the right decision about whether to buy, sell, or hold.
You might be able to find a better buy than NewMarket. If you want a selection of possible winners, check out this free list of interesting companies that trade on a P/E below 20 (but have proven they can grow earnings).
If you spot an error that warrants correction, please contact the editor at editorial-team@simplywallst.com. This article by Simply Wall St is general in nature. It does not constitute a recommendation to buy or sell any stock, and does not take account of your objectives, or your financial situation. Simply Wall St has no position in the stocks mentioned.
We aim to bring you long-term focused research analysis driven by fundamental data. Note that our analysis may not factor in the latest price-sensitive company announcements or qualitative material. Thank you for reading.
