How Do Dragon Crown Group Holdings Limited’s (HKG:935) Returns On Capital Compare To Peers?

Today we are going to look at Dragon Crown Group Holdings Limited (HKG:935) to see whether it might be an attractive investment prospect. Specifically, we’re going to calculate its Return On Capital Employed (ROCE), in the hopes of getting some insight into the business.
Firstly, we’ll go over how we calculate ROCE. Second, we’ll look at its ROCE compared to similar companies. Then we’ll determine how its current liabilities are affecting its ROCE.
Understanding Return On Capital Employed (ROCE)
ROCE is a measure of a company’s yearly pre-tax profit (its return), relative to the capital employed in the business. In general, businesses with a higher ROCE are usually better quality. Overall, it is a valuable metric that has its flaws. Renowned investment researcher Michael Mauboussin has suggested that a high ROCE can indicate that ‘one dollar invested in the company generates value of more than one dollar’.
How Do You Calculate Return On Capital Employed?
Analysts use this formula to calculate return on capital employed:
Return on Capital Employed = Earnings Before Interest and Tax (EBIT) ÷ (Total Assets – Current Liabilities)
Or for Dragon Crown Group Holdings:
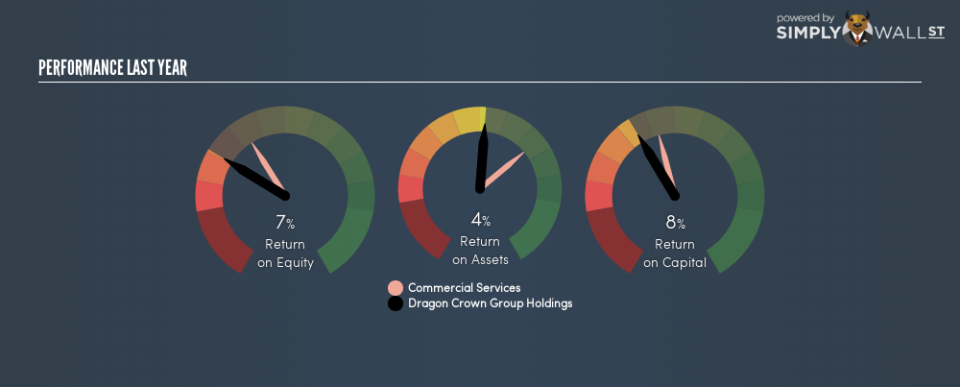
0.083 = HK$80m ÷ (HK$1.4b – HK$203m) (Based on the trailing twelve months to June 2018.)
Therefore, Dragon Crown Group Holdings has an ROCE of 8.3%.
View our latest analysis for Dragon Crown Group Holdings
Does Dragon Crown Group Holdings Have A Good ROCE?
ROCE is commonly used for comparing the performance of similar businesses. Using our data, Dragon Crown Group Holdings’s ROCE appears to be significantly below the 11% average in the Commercial Services industry. This could be seen as a negative, as it suggests some competitors may be employing their capital more efficiently. Separate from how Dragon Crown Group Holdings stacks up against its industry, its ROCE in absolute terms is mediocre; relative to the returns on government bonds. Readers may find more attractive investment prospects elsewhere.
It is important to remember that ROCE shows past performance, and is not necessarily predictive. ROCE can be deceptive for cyclical businesses, as returns can look incredible in boom times, and terribly low in downturns. This is because ROCE only looks at one year, instead of considering returns across a whole cycle. You can check if Dragon Crown Group Holdings has cyclical profits by looking at this free graph of past earnings, revenue and cash flow.
What Are Current Liabilities, And How Do They Affect Dragon Crown Group Holdings’s ROCE?
Short term (or current) liabilities, are things like supplier invoices, overdrafts, or tax bills that need to be paid within 12 months. The ROCE equation subtracts current liabilities from capital employed, so a company with a lot of current liabilities appears to have less capital employed, and a higher ROCE than otherwise. To check the impact of this, we calculate if a company has high current liabilities relative to its total assets.
Dragon Crown Group Holdings has total assets of HK$1.4b and current liabilities of HK$203m. As a result, its current liabilities are equal to approximately 14% of its total assets. It is good to see a restrained amount of current liabilities, as this limits the effect on ROCE.
The Bottom Line On Dragon Crown Group Holdings’s ROCE
If Dragon Crown Group Holdings continues to earn an uninspiring ROCE, there may be better places to invest. Of course you might be able to find a better stock than Dragon Crown Group Holdings. So you may wish to see this free collection of other companies that have grown earnings strongly.
I will like Dragon Crown Group Holdings better if I see some big insider buys. While we wait, check out this free list of growing companies with considerable, recent, insider buying.
To help readers see past the short term volatility of the financial market, we aim to bring you a long-term focused research analysis purely driven by fundamental data. Note that our analysis does not factor in the latest price-sensitive company announcements.
The author is an independent contributor and at the time of publication had no position in the stocks mentioned. For errors that warrant correction please contact the editor at editorial-team@simplywallst.com.
