DRDGOLD Limited's (NYSE:DRD) Stock's On An Uptrend: Are Strong Financials Guiding The Market?
Most readers would already be aware that DRDGOLD's (NYSE:DRD) stock increased significantly by 25% over the past three months. Given that the market rewards strong financials in the long-term, we wonder if that is the case in this instance. In this article, we decided to focus on DRDGOLD's ROE.
Return on Equity or ROE is a test of how effectively a company is growing its value and managing investors’ money. In other words, it is a profitability ratio which measures the rate of return on the capital provided by the company's shareholders.
See our latest analysis for DRDGOLD
How Do You Calculate Return On Equity?
Return on equity can be calculated by using the formula:
Return on Equity = Net Profit (from continuing operations) ÷ Shareholders' Equity
So, based on the above formula, the ROE for DRDGOLD is:
21% = R1.2b ÷ R5.6b (Based on the trailing twelve months to December 2022).
The 'return' is the profit over the last twelve months. One way to conceptualize this is that for each $1 of shareholders' capital it has, the company made $0.21 in profit.
What Is The Relationship Between ROE And Earnings Growth?
So far, we've learned that ROE is a measure of a company's profitability. We now need to evaluate how much profit the company reinvests or "retains" for future growth which then gives us an idea about the growth potential of the company. Generally speaking, other things being equal, firms with a high return on equity and profit retention, have a higher growth rate than firms that don’t share these attributes.
DRDGOLD's Earnings Growth And 21% ROE
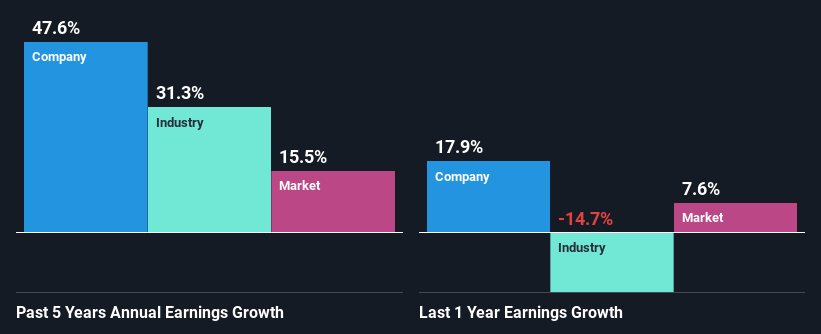
To begin with, DRDGOLD seems to have a respectable ROE. Further, the company's ROE compares quite favorably to the industry average of 17%. This probably laid the ground for DRDGOLD's significant 48% net income growth seen over the past five years. However, there could also be other causes behind this growth. For example, it is possible that the company's management has made some good strategic decisions, or that the company has a low payout ratio.
We then compared DRDGOLD's net income growth with the industry and we're pleased to see that the company's growth figure is higher when compared with the industry which has a growth rate of 31% in the same period.
Earnings growth is an important metric to consider when valuing a stock. It’s important for an investor to know whether the market has priced in the company's expected earnings growth (or decline). By doing so, they will have an idea if the stock is headed into clear blue waters or if swampy waters await. If you're wondering about DRDGOLD's's valuation, check out this gauge of its price-to-earnings ratio, as compared to its industry.
Is DRDGOLD Efficiently Re-investing Its Profits?
DRDGOLD's significant three-year median payout ratio of 52% (where it is retaining only 48% of its income) suggests that the company has been able to achieve a high growth in earnings despite returning most of its income to shareholders.
Besides, DRDGOLD has been paying dividends for at least ten years or more. This shows that the company is committed to sharing profits with its shareholders.
Summary
On the whole, we feel that DRDGOLD's performance has been quite good. In particular, its high ROE is quite noteworthy and also the probable explanation behind its considerable earnings growth. Yet, the company is retaining a small portion of its profits. Which means that the company has been able to grow its earnings in spite of it, so that's not too bad. Up till now, we've only made a short study of the company's growth data. To gain further insights into DRDGOLD's past profit growth, check out this visualization of past earnings, revenue and cash flows.
Have feedback on this article? Concerned about the content? Get in touch with us directly. Alternatively, email editorial-team (at) simplywallst.com.
This article by Simply Wall St is general in nature. We provide commentary based on historical data and analyst forecasts only using an unbiased methodology and our articles are not intended to be financial advice. It does not constitute a recommendation to buy or sell any stock, and does not take account of your objectives, or your financial situation. We aim to bring you long-term focused analysis driven by fundamental data. Note that our analysis may not factor in the latest price-sensitive company announcements or qualitative material. Simply Wall St has no position in any stocks mentioned.
Join A Paid User Research Session
You’ll receive a US$30 Amazon Gift card for 1 hour of your time while helping us build better investing tools for the individual investors like yourself. Sign up here
