What Are The Drivers Of Petrel Resources Plc’s (LON:PET) Risks?

If you are looking to invest in Petrel Resources Plc’s (AIM:PET), or currently own the stock, then you need to understand its beta in order to understand how it can affect the risk of your portfolio. PET is exposed to market-wide risk, which arises from investing in the stock market. This risk reflects changes in economic and political factors that affects all stocks, and is measured by its beta. Not all stocks are expose to the same level of market risk, and the market as a whole represents a beta of one. A stock with a beta greater than one is expected to exhibit higher volatility resulting from market-wide shocks compared to one with a beta below one.
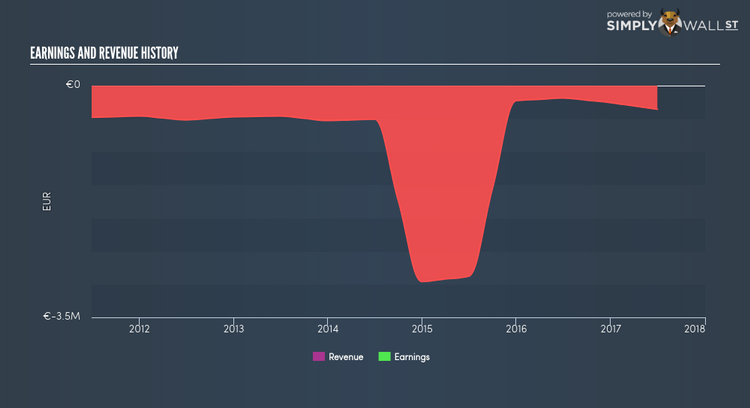
Check out our latest analysis for Petrel Resources
What does PET’s beta value mean?
Petrel Resources’s beta of 0.69 indicates that the stock value will be less variable compared to the whole stock market. The stock will exhibit muted movements in both the downside and upside, in response to changing economic conditions, whereas the general market may move by a lot more. PET’s beta indicates it is a stock that investors may find valuable if they want to reduce the overall market risk exposure of their stock portfolio.
Could PET’s size and industry cause it to be more volatile?
A market capitalisation of UK£2.39M puts PET in the category of small-cap stocks, which tends to possess higher beta than larger companies. Moreover, PET’s industry, oil and gas, is considered to be cyclical, which means it is more volatile than the market over the economic cycle. As a result, we should expect a high beta for the small-cap PET but a low beta for the oil and gas industry. It seems as though there is an inconsistency in risks portrayed by PET’s size and industry relative to its actual beta value.
Is PET’s cost structure indicative of a high beta?
During times of economic downturn, low demand may cause companies to readjust production of their goods and services. It is more difficult for companies to lower their cost, if the majority of these costs are generated by fixed assets. Therefore, this is a type of risk which is associated with higher beta. I test PET’s ratio of fixed assets to total assets in order to determine how high the risk is associated with this type of constraint. Considering fixed assets is virtually non-existent in PET’s operations, it has low dependency on fixed costs to generate revenue. As a result, the company may be less volatile relative to broad market movements, compared to a company of similar size but higher proportion of fixed assets. Similarly, PET’s beta value conveys the same message.
What this means for you:
PET may be a worthwhile stock to hold onto in order to cushion the impact of a downturn. Depending on the composition of your portfolio, low-beta stocks such as PET is valuable to lower your risk of market exposure, in particular, during times of economic decline. In order to fully understand whether PET is a good investment for you, we also need to consider important company-specific fundamentals such as Petrel Resources’s financial health and performance track record. I highly recommend you to complete your research by taking a look at the following:
Financial Health: Is PET’s operations financially sustainable? Balance sheets can be hard to analyze, which is why we’ve done it for you. Check out our financial health checks here.
Past Track Record: Has PET been consistently performing well irrespective of the ups and downs in the market? Go into more detail in the past performance analysis and take a look at the free visual representations of PET’s historicals for more clarity.
Other High-Performing Stocks: Are there other stocks that provide better prospects with proven track records? Explore our free list of these great stocks here.
To help readers see pass the short term volatility of the financial market, we aim to bring you a long-term focused research analysis purely driven by fundamental data. Note that our analysis does not factor in the latest price sensitive company announcements.
The author is an independent contributor and at the time of publication had no position in the stocks mentioned.
