Are Duluth Holdings Inc. (NASDAQ:DLTH) Investors Paying Above The Intrinsic Value?
Key Insights
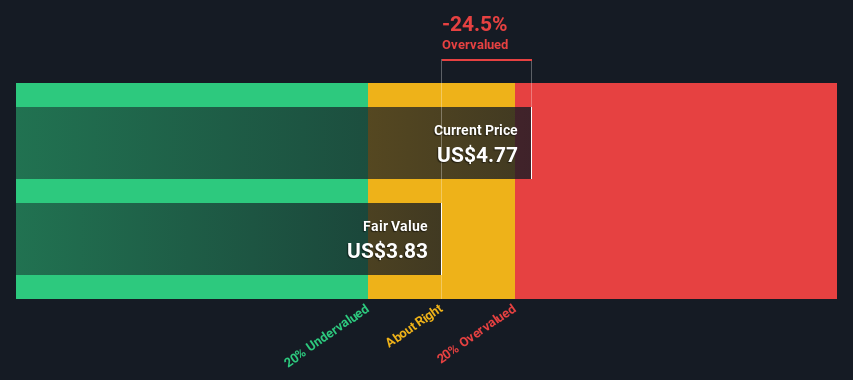
Using the 2 Stage Free Cash Flow to Equity, Duluth Holdings fair value estimate is US$3.83
Duluth Holdings' US$4.77 share price signals that it might be 24% overvalued
The US$5.00 analyst price target for DLTH is 30% more than our estimate of fair value
How far off is Duluth Holdings Inc. (NASDAQ:DLTH) from its intrinsic value? Using the most recent financial data, we'll take a look at whether the stock is fairly priced by taking the forecast future cash flows of the company and discounting them back to today's value. Our analysis will employ the Discounted Cash Flow (DCF) model. Before you think you won't be able to understand it, just read on! It's actually much less complex than you'd imagine.
We would caution that there are many ways of valuing a company and, like the DCF, each technique has advantages and disadvantages in certain scenarios. If you want to learn more about discounted cash flow, the rationale behind this calculation can be read in detail in the Simply Wall St analysis model.
Check out our latest analysis for Duluth Holdings
The Model
We use what is known as a 2-stage model, which simply means we have two different periods of growth rates for the company's cash flows. Generally the first stage is higher growth, and the second stage is a lower growth phase. To begin with, we have to get estimates of the next ten years of cash flows. Where possible we use analyst estimates, but when these aren't available we extrapolate the previous free cash flow (FCF) from the last estimate or reported value. We assume companies with shrinking free cash flow will slow their rate of shrinkage, and that companies with growing free cash flow will see their growth rate slow, over this period. We do this to reflect that growth tends to slow more in the early years than it does in later years.
Generally we assume that a dollar today is more valuable than a dollar in the future, so we need to discount the sum of these future cash flows to arrive at a present value estimate:
10-year free cash flow (FCF) estimate
2024 | 2025 | 2026 | 2027 | 2028 | 2029 | 2030 | 2031 | 2032 | 2033 | |
Levered FCF ($, Millions) | -US$11.7m | US$3.00m | US$4.93m | US$7.18m | US$9.52m | US$11.8m | US$13.8m | US$15.5m | US$17.0m | US$18.3m |
Growth Rate Estimate Source | Analyst x1 | Analyst x1 | Est @ 64.26% | Est @ 45.67% | Est @ 32.66% | Est @ 23.55% | Est @ 17.17% | Est @ 12.71% | Est @ 9.58% | Est @ 7.39% |
Present Value ($, Millions) Discounted @ 10% | -US$10.6 | US$2.5 | US$3.7 | US$4.9 | US$5.9 | US$6.6 | US$7.0 | US$7.2 | US$7.1 | US$7.0 |
("Est" = FCF growth rate estimated by Simply Wall St)
Present Value of 10-year Cash Flow (PVCF) = US$41m
We now need to calculate the Terminal Value, which accounts for all the future cash flows after this ten year period. For a number of reasons a very conservative growth rate is used that cannot exceed that of a country's GDP growth. In this case we have used the 5-year average of the 10-year government bond yield (2.3%) to estimate future growth. In the same way as with the 10-year 'growth' period, we discount future cash flows to today's value, using a cost of equity of 10%.
Terminal Value (TV)= FCF2033 × (1 + g) ÷ (r – g) = US$18m× (1 + 2.3%) ÷ (10%– 2.3%) = US$239m
Present Value of Terminal Value (PVTV)= TV / (1 + r)10= US$239m÷ ( 1 + 10%)10= US$91m
The total value, or equity value, is then the sum of the present value of the future cash flows, which in this case is US$132m. To get the intrinsic value per share, we divide this by the total number of shares outstanding. Relative to the current share price of US$4.8, the company appears slightly overvalued at the time of writing. Remember though, that this is just an approximate valuation, and like any complex formula - garbage in, garbage out.
Important Assumptions
We would point out that the most important inputs to a discounted cash flow are the discount rate and of course the actual cash flows. You don't have to agree with these inputs, I recommend redoing the calculations yourself and playing with them. The DCF also does not consider the possible cyclicality of an industry, or a company's future capital requirements, so it does not give a full picture of a company's potential performance. Given that we are looking at Duluth Holdings as potential shareholders, the cost of equity is used as the discount rate, rather than the cost of capital (or weighted average cost of capital, WACC) which accounts for debt. In this calculation we've used 10%, which is based on a levered beta of 1.704. Beta is a measure of a stock's volatility, compared to the market as a whole. We get our beta from the industry average beta of globally comparable companies, with an imposed limit between 0.8 and 2.0, which is a reasonable range for a stable business.
SWOT Analysis for Duluth Holdings
Strength
Debt is not viewed as a risk.
Weakness
Shareholders have been diluted in the past year.
Opportunity
Forecast to reduce losses next year.
Has sufficient cash runway for more than 3 years based on current free cash flows.
Good value based on P/S ratio compared to estimated Fair P/S ratio.
Threat
No apparent threats visible for DLTH.
Moving On:
Whilst important, the DCF calculation ideally won't be the sole piece of analysis you scrutinize for a company. The DCF model is not a perfect stock valuation tool. Rather it should be seen as a guide to "what assumptions need to be true for this stock to be under/overvalued?" For example, changes in the company's cost of equity or the risk free rate can significantly impact the valuation. What is the reason for the share price exceeding the intrinsic value? For Duluth Holdings, there are three pertinent aspects you should further research:
Risks: For example, we've discovered 1 warning sign for Duluth Holdings that you should be aware of before investing here.
Future Earnings: How does DLTH's growth rate compare to its peers and the wider market? Dig deeper into the analyst consensus number for the upcoming years by interacting with our free analyst growth expectation chart.
Other High Quality Alternatives: Do you like a good all-rounder? Explore our interactive list of high quality stocks to get an idea of what else is out there you may be missing!
PS. The Simply Wall St app conducts a discounted cash flow valuation for every stock on the NASDAQGS every day. If you want to find the calculation for other stocks just search here.
Have feedback on this article? Concerned about the content? Get in touch with us directly. Alternatively, email editorial-team (at) simplywallst.com.
This article by Simply Wall St is general in nature. We provide commentary based on historical data and analyst forecasts only using an unbiased methodology and our articles are not intended to be financial advice. It does not constitute a recommendation to buy or sell any stock, and does not take account of your objectives, or your financial situation. We aim to bring you long-term focused analysis driven by fundamental data. Note that our analysis may not factor in the latest price-sensitive company announcements or qualitative material. Simply Wall St has no position in any stocks mentioned.
