Duty Free International Limited's (SGX:5SO) Dismal Stock Performance Reflects Weak Fundamentals
Duty Free International (SGX:5SO) has had a rough three months with its share price down 12%. We decided to study the company's financials to determine if the downtrend will continue as the long-term performance of a company usually dictates market outcomes. Specifically, we decided to study Duty Free International's ROE in this article.
ROE or return on equity is a useful tool to assess how effectively a company can generate returns on the investment it received from its shareholders. Simply put, it is used to assess the profitability of a company in relation to its equity capital.
View our latest analysis for Duty Free International
How Do You Calculate Return On Equity?
Return on equity can be calculated by using the formula:
Return on Equity = Net Profit (from continuing operations) ÷ Shareholders' Equity
So, based on the above formula, the ROE for Duty Free International is:
4.7% = RM16m ÷ RM346m (Based on the trailing twelve months to November 2023).
The 'return' refers to a company's earnings over the last year. Another way to think of that is that for every SGD1 worth of equity, the company was able to earn SGD0.05 in profit.
Why Is ROE Important For Earnings Growth?
Thus far, we have learned that ROE measures how efficiently a company is generating its profits. We now need to evaluate how much profit the company reinvests or "retains" for future growth which then gives us an idea about the growth potential of the company. Generally speaking, other things being equal, firms with a high return on equity and profit retention, have a higher growth rate than firms that don’t share these attributes.
A Side By Side comparison of Duty Free International's Earnings Growth And 4.7% ROE
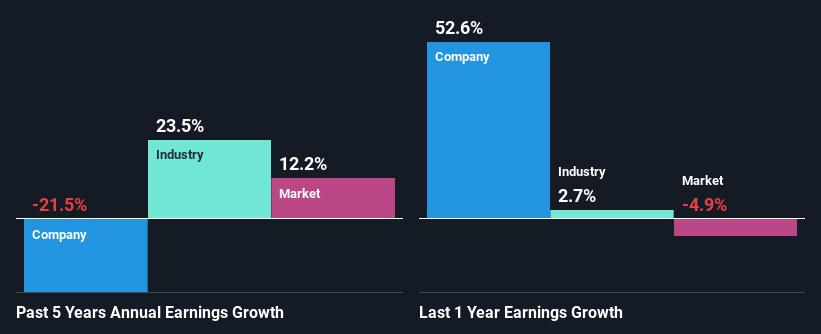
When you first look at it, Duty Free International's ROE doesn't look that attractive. A quick further study shows that the company's ROE doesn't compare favorably to the industry average of 14% either. Therefore, it might not be wrong to say that the five year net income decline of 22% seen by Duty Free International was probably the result of it having a lower ROE. We reckon that there could also be other factors at play here. For instance, the company has a very high payout ratio, or is faced with competitive pressures.
However, when we compared Duty Free International's growth with the industry we found that while the company's earnings have been shrinking, the industry has seen an earnings growth of 23% in the same period. This is quite worrisome.
Earnings growth is a huge factor in stock valuation. The investor should try to establish if the expected growth or decline in earnings, whichever the case may be, is priced in. Doing so will help them establish if the stock's future looks promising or ominous. Is Duty Free International fairly valued compared to other companies? These 3 valuation measures might help you decide.
Is Duty Free International Making Efficient Use Of Its Profits?
Duty Free International has a high three-year median payout ratio of 59% (that is, it is retaining 41% of its profits). This suggests that the company is paying most of its profits as dividends to its shareholders. This goes some way in explaining why its earnings have been shrinking. The business is only left with a small pool of capital to reinvest - A vicious cycle that doesn't benefit the company in the long-run. You can see the 2 risks we have identified for Duty Free International by visiting our risks dashboard for free on our platform here.
In addition, Duty Free International has been paying dividends over a period of at least ten years suggesting that keeping up dividend payments is way more important to the management even if it comes at the cost of business growth.
Conclusion
In total, we would have a hard think before deciding on any investment action concerning Duty Free International. As a result of its low ROE and lack of much reinvestment into the business, the company has seen a disappointing earnings growth rate. Until now, we have only just grazed the surface of the company's past performance by looking at the company's fundamentals. You can do your own research on Duty Free International and see how it has performed in the past by looking at this FREE detailed graph of past earnings, revenue and cash flows.
Have feedback on this article? Concerned about the content? Get in touch with us directly. Alternatively, email editorial-team (at) simplywallst.com.
This article by Simply Wall St is general in nature. We provide commentary based on historical data and analyst forecasts only using an unbiased methodology and our articles are not intended to be financial advice. It does not constitute a recommendation to buy or sell any stock, and does not take account of your objectives, or your financial situation. We aim to bring you long-term focused analysis driven by fundamental data. Note that our analysis may not factor in the latest price-sensitive company announcements or qualitative material. Simply Wall St has no position in any stocks mentioned.
