E-mini Dow Jones Industrial Average (YM) Futures Technical Analysis – Stronger Over 34312, Weaker Under 34100
June E-mini Dow Jones Industrial Average futures are trading higher on Tuesday, but barely holding on to earlier gains as we approach the cash market opening. Traders are showing little reaction to earnings reports from Dow components Home Depot and Walmart, and the mixed economic reports on Building Permits and Housing Starts.
At 12:58 GMT, June E-mini Dow Jones Industrial Average futures are trading 34279, up 23 or +0.07%.
Home Depot shares jumped 2% in early trading, set to add to their 20% gains year-to-date already. The retailer reported earnings of $3.86 a share for the previous quarter, much higher than the $3.08 expected by analysts polled by Refinitiv. Net Sales surged 32.7%, more than expected.
Walmart shares gained 1% in premarket trading after reporting strong grocery sales and e-commerce growth for the quarter.
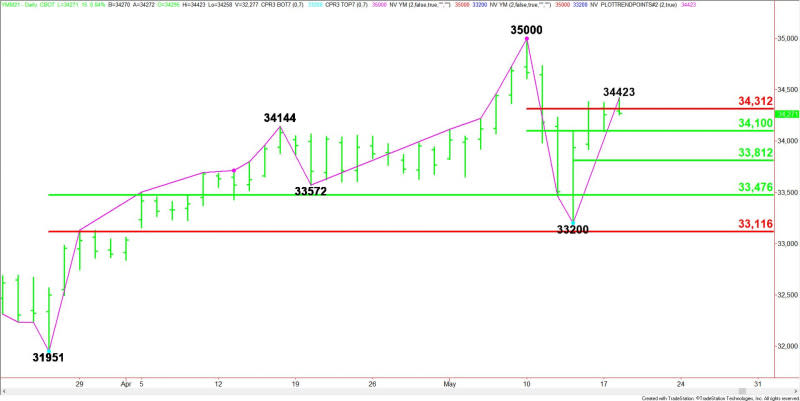
Daily Swing Chart Technical Analysis
The main trend is down according to the daily swing chart, however, momentum has been trending higher since the formation of the closing price reversal bottom on May 13.
A trade through 35000 will change the main trend to up. A move through 33200 will negate the closing price reversal bottom and signal the resumption of the downtrend.
The main range is 31951 to 35000. Its retracement zone at 33476 to 33116 is support. This zone stopped the selling at 33200 on May 13. This zone is also controlling the near-term direction of the stock index.
The short-term range is 35000 to 33200. The index is currently testing its retracement zone at 34100 to 34312. This zone is important to the structure of the market.
Since the main trend is down, sellers are going to try to form a potentially bearish secondary lower top on a test of the short-term retracement zone. Aggressive counter-trend buyers are going to try to trigger a breakout through this zone.
The new minor range is 33200 to 34423. Its 50% level or pivot at 33812 is another potential downside target.
Daily Swing Chart Technical Forecast
The direction of the June E-mini Dow Jones Industrial Average on Tuesday is likely to be determined by trader reaction to the short-term Fibonacci level at 34312.
Bullish Scenario
A sustained move over 34312 will indicate the presence of buyers. The first upside target is the intraday high at 34423. This could turn out to be the trigger point for an acceleration to the upside if the buying volume is strong enough. The daily chart indicates there is plenty of room to the upside with 35000 the next major target.
Bearish Scenario
A sustained move under 34312 will signal the presence of sellers. The first downside target is the short-term 50% level at 34100. Watch for a technical bounce on the first test of this level, but if it fails then look for the selling to possibly extend into the pivot at 33812. This is another potential buy point for aggressive counter-trend buyers and a potential trigger point for an acceleration into 33476 to 33116.
For a look at all of today’s economic events, check out our economic calendar.
This article was originally posted on FX Empire
