E-mini Dow Jones Industrial Average (YM) Futures Analysis – July 28, 2017 Forecast
September E-mini Dow Jones Industrial Average futures are under pressure shortly after the opening. However, the blue chip market is preforming better than the S&P 500 Index and the NASDAQ Composite because of lower exposure to the technology sector.
Technical Analysis
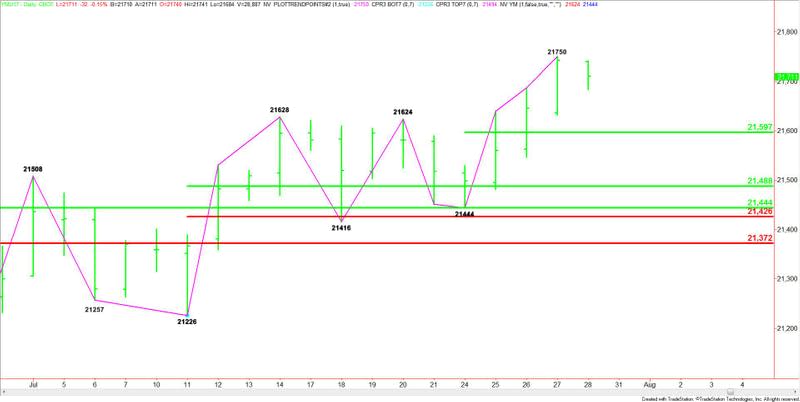
The main trend is up according to the daily swing chart. While the other major indexes were reversing to the downside on Thursday, the Dow was hovering about a record high. A trade through 21444 will change the main trend to down.
The market is also in the window of time for a closing price reversal top. This will form after a higher-high then lower-close.
The short-term range is 21444 to 21750. Its 50% level or pivot at 21597 is the first downside target.
Other potential support levels come in at 21488, 21444, 21426 and 21372.
Forecast
The tone of the market today will be determined by trader reaction to yesterday’s close at 21743.
A sustained move over 21743 will indicate the presence of buyers. A sustained move under this price will indicate the buying is weak or the selling is getting stronger.
Overtaking 21750 then closing below 21743 will form the closing price reversal top.
Unlike the other indexes, the Dow is not in a position to post a weekly closing price reversal top. However, if there is a 200+ point sell-off, it could form on a close under 21518.
This article was originally posted on FX Empire
More From FXEMPIRE:
E-mini Dow Jones Industrial Average (YM) Futures Analysis – July 28, 2017 Forecast
Dow Jones 30 and NASDAQ 100 Price Forecast July 20, 2017, Technical Analysis
U.S. Stocks Closed Mixed; Amazon Tumbles 3% in After-Market Session
E-mini Dow Jones Industrial Average (YM) Futures Analysis – July 27, 2017 Forecast
S&P 500; US Indexes Fundamental Daily Forecast – Higher Opening Expected on Facebook Beat
Major US Indices Forecast, July 27, 2017, Technical Analysis
