E-mini NASDAQ-100 Index (NQ) Futures Technical Analysis – Bulls Trying to Establish New Higher Bottom at 7378.25
E-mini NASDAQ-100 futures are trading higher early Tuesday as concerns over Turkey’s economic woes eased. Investors are likely to continue to track the developments in the country, but profit-taking in the safe-haven U.S. Dollar, Japanese Yen and Treasury markets suggest the worst may be over, at least temporarily.
At 0625 GMT, September E-mini NASDAQ-100 Index futures are trading 7448.00, up 31.00 or +0.42%.
Daily Swing Chart Technical Analysis
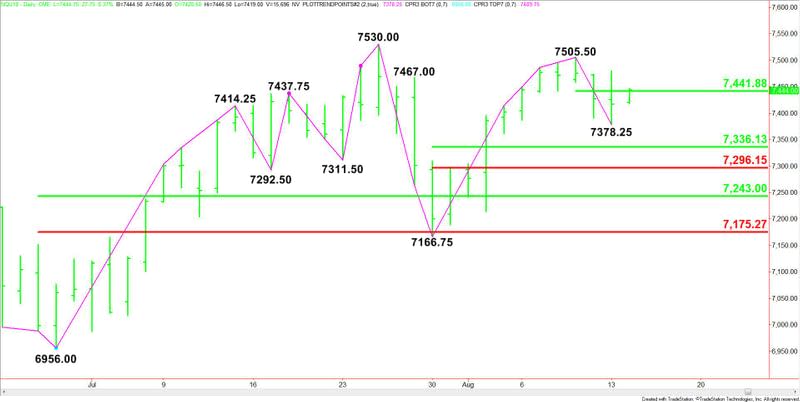
The main trend is up according to the daily swing chart. However, momentum is trending lower. A trade through 7505.50 will signal a resumption of the uptrend with 7530.00 the next target. A trade through 7378.25 will indicate the selling is getting stronger.
The minor trend is down. It turned down on Monday when sellers took out 7390.75. This move shifted momentum to the downside. The new minor top is 7479.00. A move through this level will change the minor trend to up and shift momentum to the upside.
The minor range is 7505.50 to 7378.25. Its 50% level or pivot is 7442.00. This price is currently being tested.
The short-term range is 7166.75 to 7505.50. Its retracement zone at 7336.00 to 7296.00 is the first downside target.
The main range is 6956.00 to 7530.00. Its retracement zone at 7243.00 to 7175.25 is major support.
Daily Swing Chart Technical Forecast
Based on the early price action, the direction of the September E-mini S&P 500 Index is likely to be determined by trader reaction to the short-term pivot at 7442.00.
A sustained move over 7442.00 will indicate the presence of buyers. If this move generates enough upside momentum then look for a possible test of 7505.50. Taking out this top will signal a resumption of the uptrend with 7530.00 the next target. It will also make 7378.25 a new main bottom.
A sustained move under 7442.00 will signal the presence of sellers. This could trigger a sharp break into 7378.25. If this low fails then look for the selling to extend into the 50% level at 7336.00, followed by the Fibonacci level at 7296.00. We could see a technical bounce on the first test of these levels.
7296.00 is the trigger point for an acceleration into 7243.00, followed by 7175.25 and 7166.75.
This article was originally posted on FX Empire
More From FXEMPIRE:
Technical Overview of EUR/USD, USD/JPY, NZD/USD & USD/CHF: 14.08.2018
Oil Price Fundamental Daily Forecast – Prices Firm as Supply Concerns Offset Demand Worries
EUR/USD Daily Price Forecast – EUR/USD Recovers Yesterday’s Loss Post German Macro Data Update
DAX Index Price Forecast – DAX Turns Range Bound Post Euro Zone Macro Data Update
